By: Derek Lim

After reading several investment books, I have decided to adopt Peter Lynch's investing style because his approach is the most straight forward and easily understandable. All the information required is easily available from the respective company website, annual reports and financial statements.
The analysis here is solely base on his book "
One Up On Wall Street".
I will start with Hong Leong Finance first because it constitutes to almost three quarter of my portfolio. In case you are wondering, I bought this stock early last year because I was too caught up with the S44 credits and did not do a proper analysis. That was the boom time then where almost any stock is bound to make money. What can go wrong right? RIGHT!
1) Stock Classification - Stalwarts (10-12% growth rate)
A reasonably large and stable company that has been listed since 1981. It has weathered through the recession of '85, the '97 financial crisis, the dot com bust, SARs and now the Sub-prime crisis. Hence, I'm confident that it will be able to handle the current crisis.
2) Price/ Earnings ratio vs similar companies
Also known as the P/E ratio, it can be thought of as the number of years it will take for the company to earn back the amount of your initial investment.
I did a search in POEMs and HLF was categorized under S&Ls/Savings Banks and there are only two companies in the same category - Sing Investments & Finance Limited and Singapura Finance Limited.

HLF has a very high P/E ratio as compared to Singupura Finance. It will take approximately 12-13 years for me to earn back my initial investment. To justify the P/E ratio, it will at least have to have a double digit growth rate. However in the wake of the gloomy market sentiments, this is unlikely and 2Q2008 results have confirm that.
For good measure, I decided to find out the P/E ratio of the 3 local banks.
 3) Institutional Ownership
I don't really hear a lot about this stock except for the occasional rumblings in CNA forum. To Peter Lynch, no news is good news. I did however manage to find a recent coverage by
NRA Research published on 13 Aug 2008 but I didn't have the chance to read it because I have to pay to read it!
Hong Leong Group is the majority shareholder (about 33%) and next major institutional investor is DBS Nominees at 6.73%. No wonder none of the big brokerage firms wants to cover it.
4) Insider Buyer
There has been no insider buying for the last 2 years except for Chairman Kwek Leng Beng yearly acceptance of his options.
5) Earnings and Growth Rate.
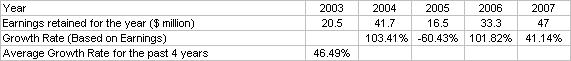
This is a surprised. I expected a consistent growth rate and not one that goes up 100+% only to fall by -60%.
I email HLF for a copy of their 2005 and 2006 to find out about the fall in earnings in 2005 and I'm pleasantly surprised that their VP Accounts sent me the softcopy on the next working day. The fall in earnings is attributed to the increase in unsecured borrowings. Since the 2001 and 2002 figures are available in the 2005 AR, I decided to combine them together.

The results are shocking. Suddenly HLF doesn't look so stable after all. It seems more of a cyclical stock. If I compare the earnings in 2007 to 2001, it has drop by 29.5%
6) Balance Sheet - debt-to-equity ratio
This is where things start to get a little complicated. After scrutinizing the AR, I realized that HLF does not have any debt. My guess is financial institutions don't use the word debt but rather liabilities or loan repayment which may explain why sub-prime mortgage is so messy.
In my analysis of HLF liabilities, I will omit "Deposits and savings accounts" because banks must always be able to meet all its withdrawals. Hence though more deposits and savings means more business, it also means more liabilities. Even if I were to use a Capital Adequacy Ratio (CAR) of 12%, my debt-to-equity ratio will still be almost 100% debt.
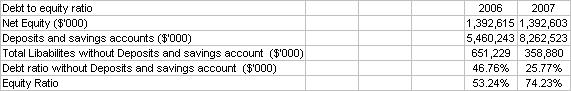
While net equity remains constant, deposits and savings have went up and so has the debt ratio has went down. Both are good signs.
Cash Position - Net Cash per share
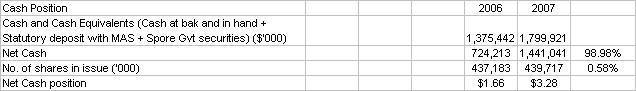
$3.28 per share! It is indeed too good to be true. If you remember earlier, I have omitted "Deposits and savings accounts" from the liabilities. However, the positive news is a almost 100% increase in net cash while the no. of shares remain about constant.
Dividend
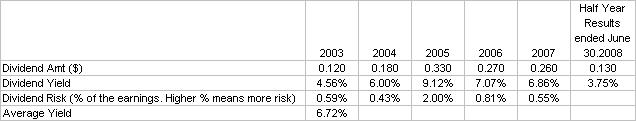
An average yield of 6.75% over 5 years. Base on 1H2008 dividends payout, HLF should be on its way in achieving the average yield target.
There are of course more in dept analysis that can be done but my aim is to get the main fundamentals right and as short and crisp as possible.
I have been contemplating on several occasions if I should buy more to average down and if so at what price or should I just hold forever or sell but I can't decide because I don't have any facts and numbers.
It is very easy to mix up a cyclical stock with others such as a stalwart. Every stock will go through different cycles. Hence while I still consider HLF as a stalwart, it is current in the cyclical stage.
According to Lynch, the key issue when buying a cyclical stock is timing and for stalwart is the price and the p/e ratio. In other words, if I can anticipate the shrinking p/e ratio over time, I will be able to pick up the stock at a cheap price and when the business will pick up again.
At current p/e ratio of 12.41 and amid the negative market outlook, it is too high. I will only be comfortable if the p/e ratio falls to 10 and below hence I have set a price of
$2.90 for my next review.


Hi derek,
Good job, I enjoyed the flow of your arguments :)
A few things to discuss:
1. You used earnings retained to determine the earnings growth. What is earnings retained? It is earnings minus the dividends distributed? Why not use the total earnings instead?
Another point is that I think earnings per share should be used instead of total earnings. This is because the share holdings might change in the period. So it there are big inputs in capital, it is expected to earn more earnings right? But if you used total earnings, this might be overlooked.
2. You should use compounded annual growth rate (CAGR) for earnings, instead of using the average growth. If you use CAGR, the retained earnings growth rate from 2002 to 2007 is about 23.1% instead of 46%+ that you calculated using simple average. Again, I urge you to re-calculate the earnings on a per share basis instead of total earnings.
3. You mentioned about high PE of 12. Actually, for financials, the PE is about there, 11-13. I do not think it’s particular high. You should check out DBS, UOB, OCBC too as I think they are comparables. Peter lynch mentioned using PEG to decide if the PE is justified or not.
PEG = PE/earnings growth rate
If PEG =1, this means that the PE for the company is justified given the earnings growth rate. Of course, to get in at margin, we’ll want the earnings growth rate to be even higher than the PE, giving us a PEG of less than 1. That will be a rough gauge of a gem that nobody wants.
4. For banks, the normal rules for liabilities are inversed. In fact, the more liabilities they have, the better for them because they will be able to borrow at low cost (0.25%?) and lend at high rates (3-6%?), pocketing the difference. As such, I believe you should look more on the net interest income (is there such a thing?) earned per equity, that should tell you the profitability of their business. ROE is also a good gauge. But take note, ROE of banks, because of their high leverage, should be around 15 to 20%. Any less than that is worth investigating why.
5. I don’t understand what is meant by your net cash. Net of what? Is it the total cash minus all required holdings?
6. Why classify it as stalwart? How did you get the growth (actually what growth did you measure – revenue, earnings or net assets?) of 10 – 12% to classify as a stalwart?
Sgbluechip also had HLF. Maybe you can take a look at his posting:
http://sgbluechip.blogspot.com/2008/08/hong-leong-finance-time-to-buy.html
Hi derek,
Sorry for flooding your comments again.
I saw their financial highlights from their website:
http://www.hlf.com.sg/invrel/fh/ar2007_1to3.pdf
Noticed a few things:
1. The shares issued didn’t change a lot, a good sign.
2. EPS’s CAGR from 2003 to 2007 is 14% which is great. But retained earnings growth rate is 23.1%. I think you should find out why is there such a big difference.
3. I calculated from 1H08 results that the annualised ROE is around 9%. That’s a little on the low side I believe.
hmm, did you received my earlier comments? I posted 3 comments, inclusive of this one.
Hi LP,
Yep there are 3 comments. Your first one was filtered as spam and I have since retrieve it.
Thanks for your valuable input. I will go through it this weekend. Didn’t know Sgbluechip also did a write up on HLF. Hope to learn something from him as well.
Cheers!