


 Looking at 1H FY 2010 revenue breakdown, Engine Systems and Oilfield Engineering roughly contributed equal proportions to total revenue, as compared to 1H FY 2009 when the ratio was more skewed towards Oilfield Engineering (at 55.9% versus 44.1%). This was due to the weakening of demand in the O&G sector as major players cut their E&P spending and caused a slump in oil prices (and hence demand for repair services which MTQ provides). On the other hand, revenues for Engine Systems remained fairly stable at around S$20 million, and were flat year-on-year, and this demonstrates steady demand for MTQES’ offerings in spite of the global financial crisis. From the first half analysis alone, it can be seen that despite Engine Systems being a much lower margin division as compared to Oilfield Engineering, it has a more stable revenue base and more sustained demand. Let’s move on to second half now (figures for 2H are derived by subtracting 1H figures from FY numbers). Read more...
Part 2 of my analysis and review shall focus on MTQ’s business divisions, namely Oilfield Engineering and Engine Systems. I shall be comparing the proportion of revenues taken up by each division as well as delving into the net margins provided by each division. A year-on-year comparison will be made to judge if there has been any improvement in each division, and I will also comment on the overall business climate and environment for MTQ going forward, based on pertinent facts which I am aware of right now.
MTQ BUSINESS UNIT ANALYSIS
Revenue Breakdown – FY 2010 Vs FY 2009 (1H and 2H)
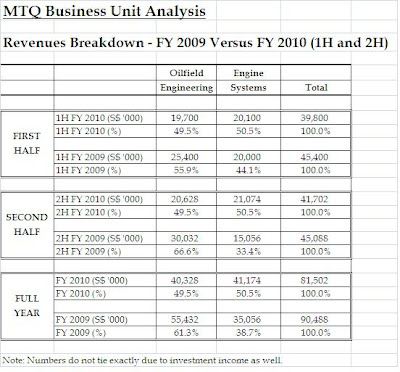 Looking at 1H FY 2010 revenue breakdown, Engine Systems and Oilfield Engineering roughly contributed equal proportions to total revenue, as compared to 1H FY 2009 when the ratio was more skewed towards Oilfield Engineering (at 55.9% versus 44.1%). This was due to the weakening of demand in the O&G sector as major players cut their E&P spending and caused a slump in oil prices (and hence demand for repair services which MTQ provides). On the other hand, revenues for Engine Systems remained fairly stable at around S$20 million, and were flat year-on-year, and this demonstrates steady demand for MTQES’ offerings in spite of the global financial crisis. From the first half analysis alone, it can be seen that despite Engine Systems being a much lower margin division as compared to Oilfield Engineering, it has a more stable revenue base and more sustained demand. Let’s move on to second half now (figures for 2H are derived by subtracting 1H figures from FY numbers). Read more...
Looking at 1H FY 2010 revenue breakdown, Engine Systems and Oilfield Engineering roughly contributed equal proportions to total revenue, as compared to 1H FY 2009 when the ratio was more skewed towards Oilfield Engineering (at 55.9% versus 44.1%). This was due to the weakening of demand in the O&G sector as major players cut their E&P spending and caused a slump in oil prices (and hence demand for repair services which MTQ provides). On the other hand, revenues for Engine Systems remained fairly stable at around S$20 million, and were flat year-on-year, and this demonstrates steady demand for MTQES’ offerings in spite of the global financial crisis. From the first half analysis alone, it can be seen that despite Engine Systems being a much lower margin division as compared to Oilfield Engineering, it has a more stable revenue base and more sustained demand. Let’s move on to second half now (figures for 2H are derived by subtracting 1H figures from FY numbers). Read more...


