Let's do some analysis on the charts for STI for practice. As usual, I'll look at both time frames - the weekly and the daily. Weekly should play a more important role as compared to daily. With the analogy of a man walking his dog, the weekly will be the direction that the man is heading to, while the daily is the movement that the dog is moving with reference to the man. Sometimes the dog will dash forward to inspect some interesting things and the man will pull on the leash to rein it back, other times it will linger on behind the man and he will have to pull the leash to hurry it forward. However the dog moves, it is moving generally in the direction that the man is moving.
Weekly:
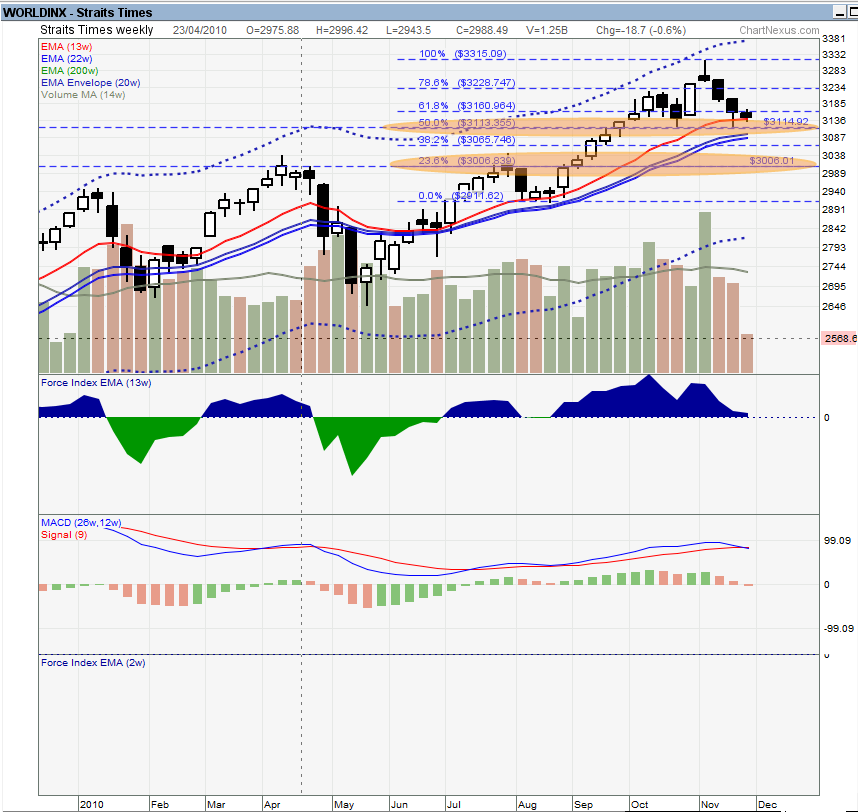
The weekly chart for STI shows a rather bleak picture. I identified 2 support lines, one ......