


Today will be our first trading day for 2011 and we thought it would be nice to kick off by reviewing past 10 years history of our world indices and commodities.

Singapore (STI)
STI reaches the 10 years peak level approximately approaching end of 2007 whereby the Lehman brother bankruptcy triggered the global economics crisis that went most countries into recession mode.
It was one of the biggest pullbacks whereby STI falls back to 2003 level.
Luckily our countrymen have fought very hard for the past years to recover and now STI is back to the pre-crisis level.
However it also served as a warning to traders that any upside in 2011 will be limited especially when STI approaches to the 10 years peak level. The traditional method of “Buy & Hold” will no longer be working perfectly as market will swing more volatile than ever.
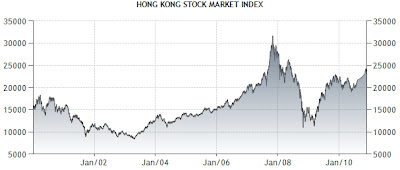
Hong Kong (Hang Seng)
...
...


