


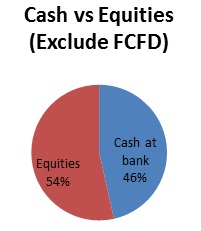
 It’s been quite a while since I last updated my portfolio. This pie chart shows what is my cash/equities position as at 12 May 2011. As you can see, I’m still fairly conservative at this point in time. Partly because 46% of my my investible savings is in cash as it backs up the outstanding mortgage loan that I still have for my home. I.e. I am still carrying on with the loan until the three year lock-in is over as I don’t want to pay back the legal subsidy etc. and my current mortgage package allows offset interest so my interest cost is quite low each month.
My current equities holdings are in the following stocks, the % in brackets denote % of my investible assets portfolio (at lower of cost/market). Note that the sum of % does not equal to 54% equities due to my lower of ......
It’s been quite a while since I last updated my portfolio. This pie chart shows what is my cash/equities position as at 12 May 2011. As you can see, I’m still fairly conservative at this point in time. Partly because 46% of my my investible savings is in cash as it backs up the outstanding mortgage loan that I still have for my home. I.e. I am still carrying on with the loan until the three year lock-in is over as I don’t want to pay back the legal subsidy etc. and my current mortgage package allows offset interest so my interest cost is quite low each month.
My current equities holdings are in the following stocks, the % in brackets denote % of my investible assets portfolio (at lower of cost/market). Note that the sum of % does not equal to 54% equities due to my lower of ......


