


Previously I had shown few examples on Bullish Divergence, I guess it is the time to record something on the other other extreme - bearish divergence.
Although I been discussing about TA recently, overall I am still a more FA person. Fundamentally strong companies should be first consideration before TA. (of course, money management, psychology and current market sentiments are much more important.) However, its good to learn from both school of thoughts.
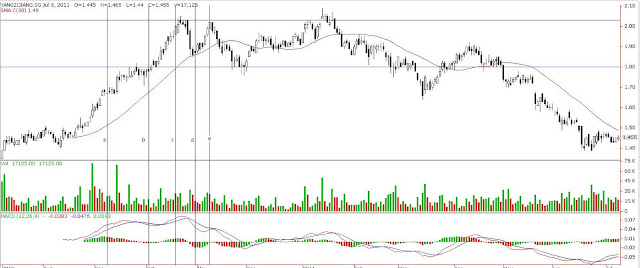 I listed 5 vertical lines in this chart.
a-b-c-d-e
a-b-c:
Price goes higher high but MCAD histogram goes lower high with b crossing below the center line. This indicate bearish divergence.
A few days after c where the red MCAD histogram bar start to appearing is a good sell.
d:
price decrease and MCAD histogram went below center line
e:
price went up again to previous high but mcad still cannot make it and did ......
I listed 5 vertical lines in this chart.
a-b-c-d-e
a-b-c:
Price goes higher high but MCAD histogram goes lower high with b crossing below the center line. This indicate bearish divergence.
A few days after c where the red MCAD histogram bar start to appearing is a good sell.
d:
price decrease and MCAD histogram went below center line
e:
price went up again to previous high but mcad still cannot make it and did ......


