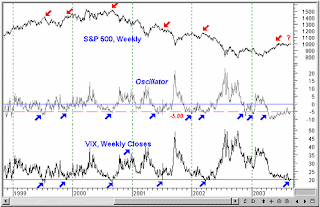
 As you can see from the graph above, when the VIX has dropped to relatively low number of 20, a major sell-off will follow shortly after that. This means ......
VIX is a traditional symbol for a volatility index. It is a measured of the level of impled volatility, not a historical volatility, based on the S&P 500 market. This particular indicator is seen as a "investor fear gauge". In general, VIX starts to rise during times of financial distress (e.g we have seen VIX of 80 during the 2008 GFC and VIX of 45 during the recent Eurozone trouble) and lessens as investors become complacent.
Historically, this pattern in the relationship between the VIX and the behavior of the stock market, has repeated itself in bull and bear cycles across the years.For beginner investor, you may want to refer to this simple indicator before you decide to buy.
 As you can see from the graph above, when the VIX has dropped to relatively low number of 20, a major sell-off will follow shortly after that. This means ......
 As you can see from the graph above, when the VIX has dropped to relatively low number of 20, a major sell-off will follow shortly after that. This means ......


