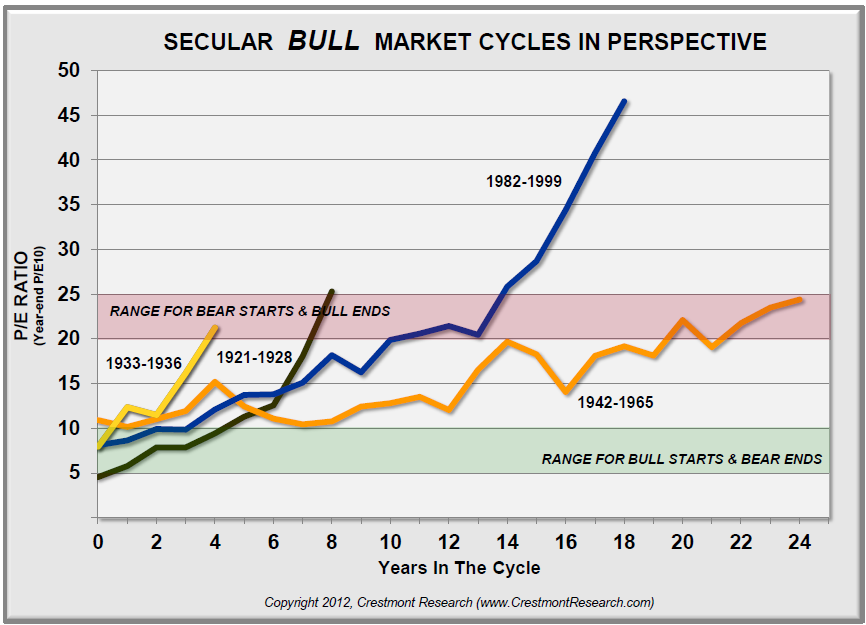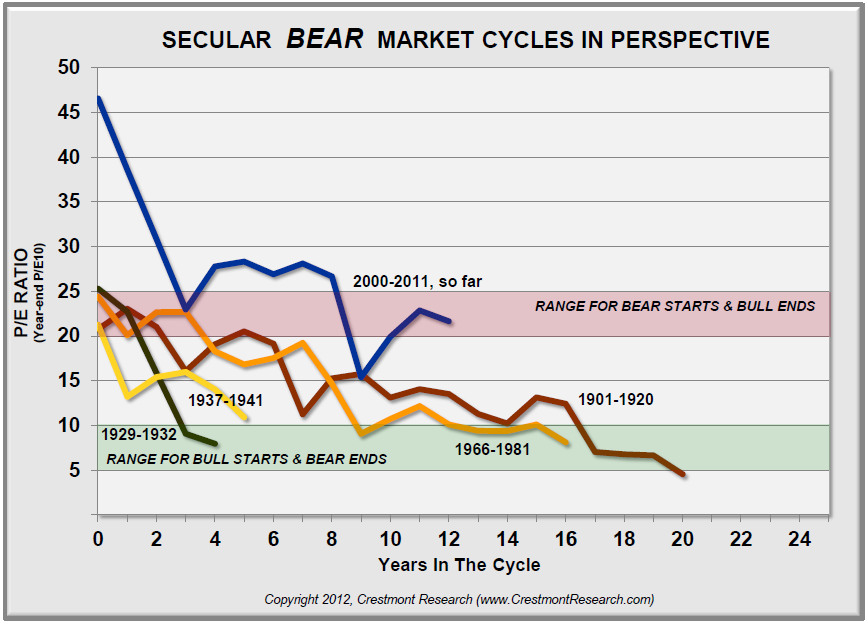

Looks like we are still far off from PE point of view. Almost all PE gets to the 10 region.
It also depends on your how you compute the PE. The PE in 2009 did get down to nearly 12 for S&P 500.
Currently, it looks very close to 1901 to 1920.
These charts are from Crestmont research, and they do have a comment to make of the PE used:
...The driver of secular stock market cycles is the inflation rate–toward or away from price stability. That causes significant changes in the level of P/E, the multiplier of earnings that causes above- and below-average return periods. Some analysts do combine the secular periods from the late ‘20s to the early ‘40s, but that masks the fundamentals of underlying cycles. For the ’20s-’40s, the first cycle was a decline into deflation (bear), then the return to price stability (bull), then the ...


