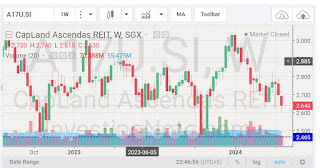
On Monday, Midas re-tests the resistance at $0.405 and closed at $0.40 with HIGH volume of 40.69 million shares traded.
Both RSI & MACD are bullish though RSI at overbought region.
Important Resistance of Midas: $0.405
Immediate Support of Midas: $0.375
Currently prices are well above the 20/50/100/200 days MA.
Today prices have re-test the critical resistance at $0.405 with high volume for the second day. Profit taking well be well expected for the current over overbought
The resistance at $0.415 is expected to be strong.
Too late to buy on the overbought market. We would suggest to sell on the resistance of $0.405 if vested.
Stock Chart: Midas! is contributed by : Singapore Stock Information Exchange