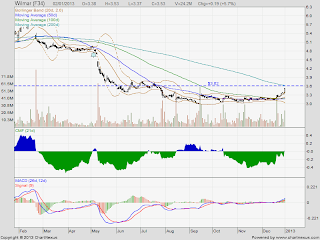
Today, one person asked me if she should still buy Wilmar's shares while another person asked me where is the first resistance level in case share price continues to rise. One person is thinking of putting in a long position while another person is thinking of possibly divesting.
 |
| Daily chart |
It is obvious to any chartist that Wilmar's share price broke resistance.
On the daily chart, the descending 200dMA at $3.62 or so is where we would find the next resistance level. The 200dMA could push share price down in the near term. It has that ability. If that should happen, then, it presents a chance for anyone who missed the boat earlier to buy in.
 |
| Weekly chart |
If the 200dMA could be overcome, then, looking at the weekly chart, we see the next significant resistance provided by the declining 50w MA. In very bullish circumstances, we could see ......


