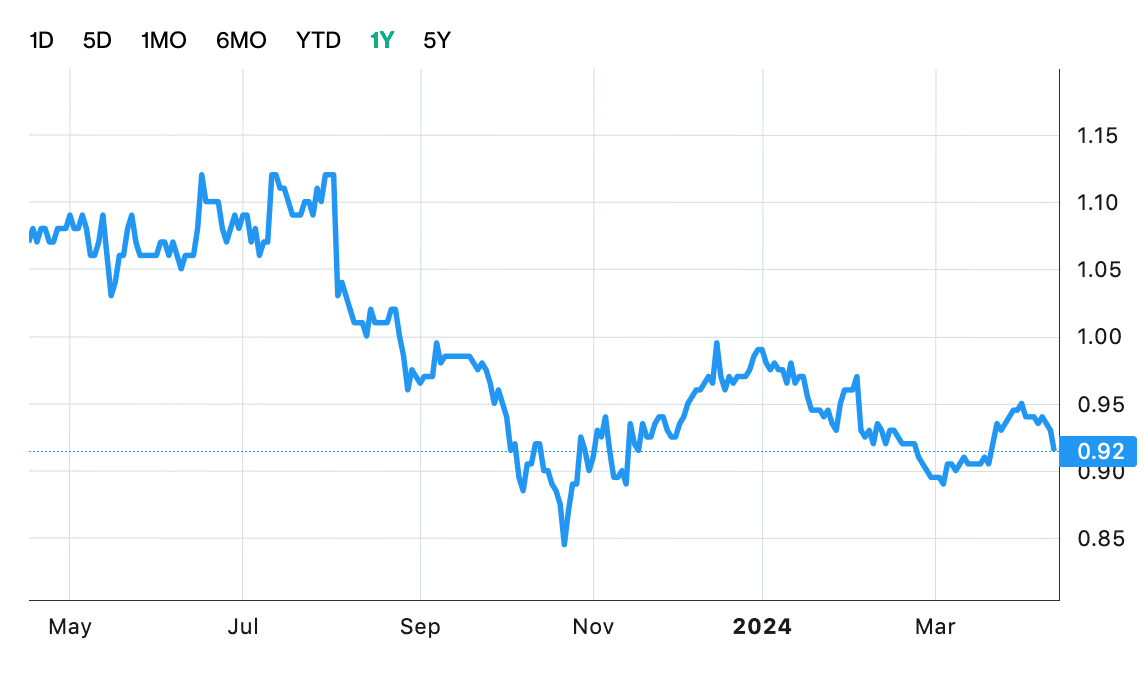
On Friday, Wilmar re-tests the resistance at $3.27 and closed at $3.25 with HIGH volume of 44.16 million shares traded.
Both RSI & MACD are flat as RSI trend sideways.
Important Resistance of Wilmar: $3.27
Immediate Support of Wilmar: $3.09
Currently prices are resisted by 20/50 days MA at $3.27/3.30
On Friday, prices tried to break the critical resistance at $3.27/$3.30 with high buying pressure but failed. This affirms on the strong attempts by the bull.
The resistance at $3.27/3.30 is expected to be strong.
We see the opportunity for reversal for Wilmar in the coming week. Do watch for the breach of $3.27/3.30 resistance with high buying pressure if interested.
Stock Chart: Wilmar! is contributed by : Singapore Stock Information Exchange