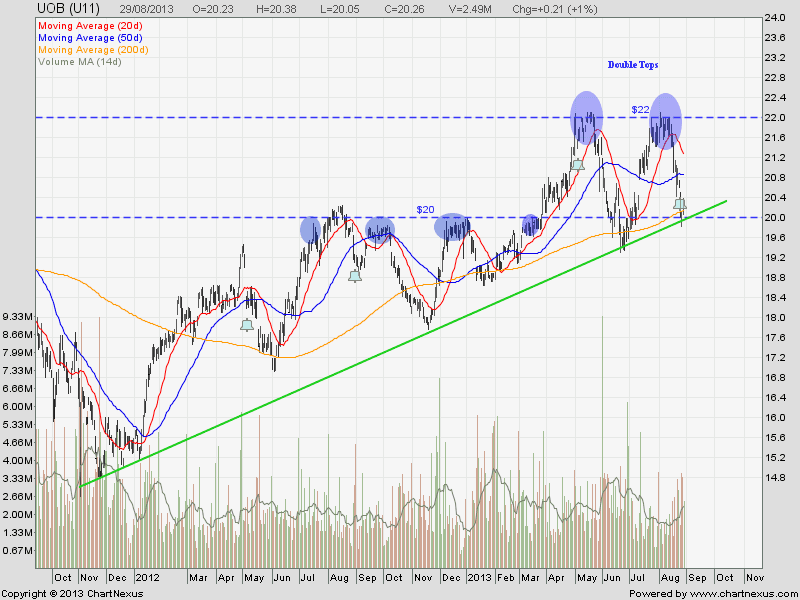
Currently UOB has just rebounded from the uptrend support with next significant resistance at $22. Alternatively, UOB can go as low as $18 if the uptrend support (also the neckline of the Double Tops & 200D SMA support) is broken at about $20.
Simply love it!
Key Statistics for UOB
| Current P/E Ratio (ttm) | 11.3501 |
|---|---|
| Estimated P/E(12/2013) | 11.4918 |
| Relative P/E vs. FSSTI | 0.9236 |
| Earnings Per Share (SGD) (ttm) | 1.7850 |
| Est. EPS (SGD) (12/2013) | 1.7630 |
| Est. PEG Ratio | 1.6034 |
| Market Cap (M SGD) | 31,914.11 |
| Shares Outstanding (M) | 1,575.23 |
| 30 Day Average Volume | 1,910,367 |
| Price/Book (mrq) | 1.3496 |
| Price/Sale (ttm) | 3.7070 |
| Dividend Indicated Gross Yield | 2.96% |
| Cash Dividend (SGD) | 0.2000 |
| Last Dividend | 08/26/2013 |
| 5 Year Dividend Growth | 1.49% |
| Next Earnings Announcement | 11/05/2013 |


