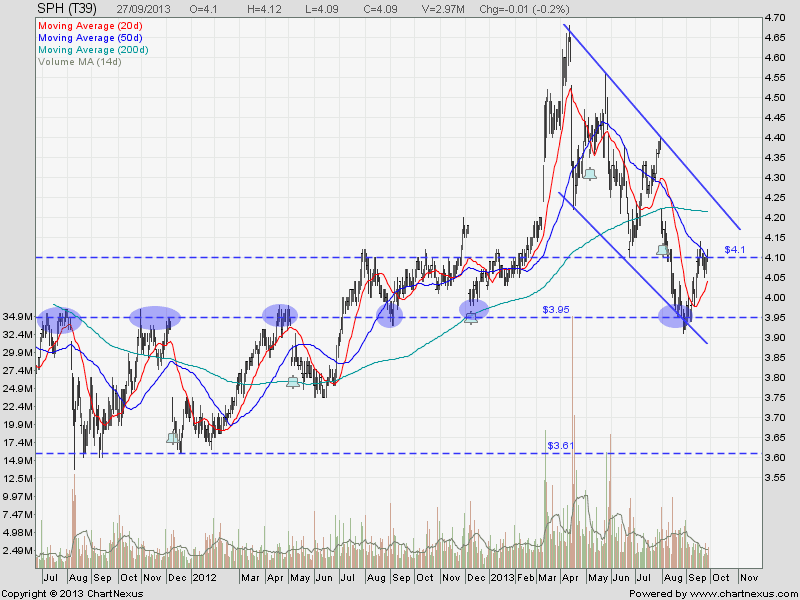
SPH is currently trading in a Down Trend Channel. Currently testing a resistance at $4.10. Next significant Resistance at about $4.20 (200D SMA and the down trend channel resistance). Immediate support at $3.95-$4.00.
Key Statistics for SPH
| Current P/E Ratio (ttm) |
14.6071 |
| Estimated P/E(08/2013) |
18.4234 |
| Relative P/E vs. FSSTI |
1.1091 |
| Earnings Per Share (SGD) (ttm) |
0.2800 |
| Est. EPS (SGD) (08/2013) |
0.2220 |
| Est. PEG Ratio |
- |
| Market Cap (M SGD) |
6,538.48 |
| Shares Outstanding (M) |
1,598.65 |
| 30 Day Average Volume |
3,488,533 |
| Price/Book (mrq) |
1.7589 |
| Price/Sale (ttm) |
5.3156 |
| Dividend Indicated Gross Yield |
3.91% |
| Cash Dividend (SGD) |
0.1800 |
| Last Dividend |
08/01/2013 |
| 5 Year Dividend Growth |
9.24% |
| Next Earnings Announcement |
10/11/2013 |
...


