


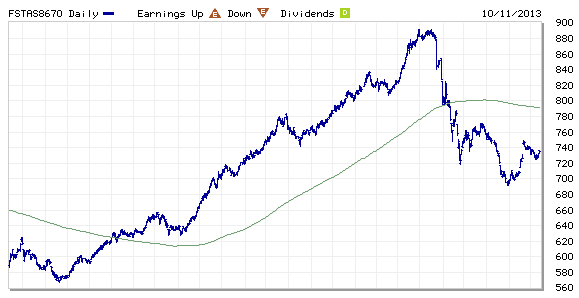
FTSE ST Real Asset Investment Trust (FTSE ST REIT) Index changes from 699.17 to 735.74 compare to last post on Singapore REIT Fundamental Comparison Table on Sept 6, 2013. The index is still trading below 200D SMA and technically bearish. However, there is sign of potential reversal if the index break the recent high of 750 as it will be forming an Inverted Head and Shoulders, a reversal chart pattern. Alternatively, the index will continue the down trend if rejected at the down trend channel resistance at about 740.
- Price/NAV increases from 0.9763 to 1.018.
- Dividend Yield decreases from 6.41% to 6.23%.
- Gearing Ratio remains the more or less the same at 33.07%.
- In Short, some Singapore REIT become attractive in terms of valuation and distribution yield again. However technically Singapore REIT is still on down trend and the ...


