


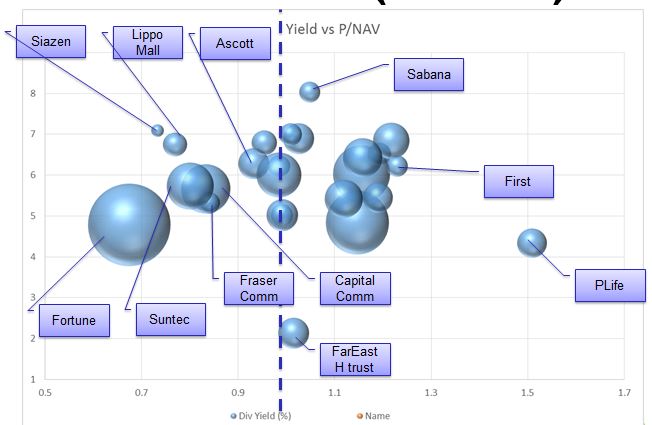
REIT Price/NAV vs Dividend Yield
If you like me is a visual person, will like the below graphical representation of all the Singapore REITs in a single chart. Framed by Price/NAV on the X-axis and Dividend Yield on the Y-axis.
In my earlier article, I talked about why I use the 2 criteria as my first pass filter. Price/NAV gives me a gauge of how much I am paying for the asset that the REIT owns. If the value is less than 1, it means I am buying the counter with a discount. For Dividend Yield, the higher the better.
How do I use the REIT chart?
Well, I will start my filter by ignoring those that have higher than 1 P/NAV ratio. I want to have a buffer on the value of the assets thus I will not look at anything on the right side of the ...
...


