


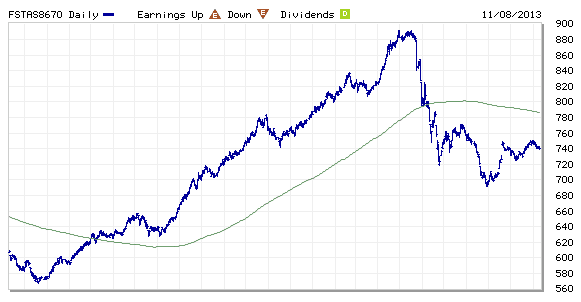
FTSE ST Real Asset Investment Trust (FTSE ST REIT) Index changes from 735.74 to 740.76 compare to last post on Singapore REIT Fundamental Comparison Table on Oct 12, 2013. The index is still trading below 200D SMA and technically bearish. However, there is sign of potential reversal if the index break the recent high of 750 as it will be forming an Inverted Head and Shoulders, a reversal chart pattern. Currently the index has moved out from the down trend channel and trading sideway. 750 is the resistance to watch. Fundamentally there is still a fear of interest hike in near future which dampen the investment sentiment in REIT.
- Price/NAV increases from 1.018 to 1.0213.
- Dividend Yield decreases from 6.23% to 6.15%.
- Gearing Ratio reduced from 33.07% to 32.92%.
- In general, Singapore REIT is at the Fair ...


