


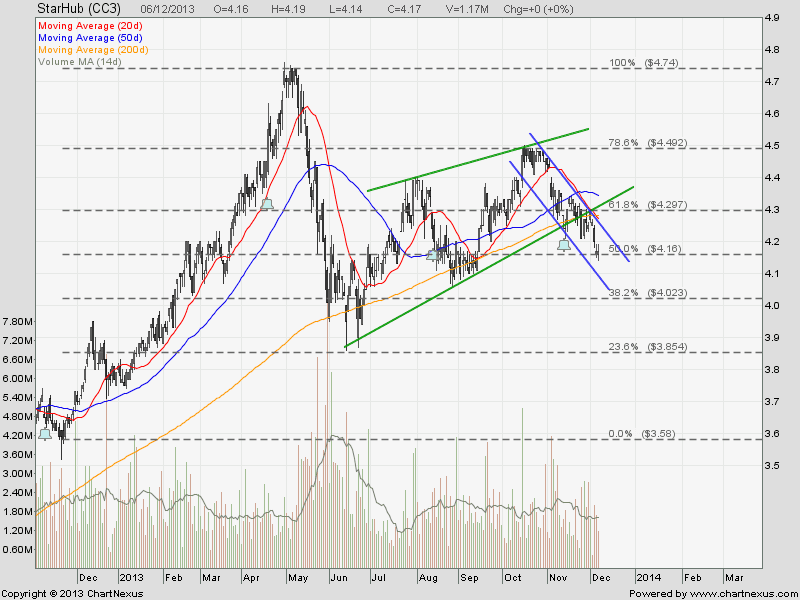
Starhub looks like breaking out from a Rising Wedge and start trading in a down trend channel. Starhub recently retested 200D SMA resistance but failed. Price target is $3.90 if this breakout is successful. The chart is bearish as Starhub is trading below all 3 moving averages.
See previous analysis for Starhub.
Key Statistics for STH
| Current P/E Ratio (ttm) | 19.1548 |
|---|---|
| Estimated P/E(12/2013) | 19.2166 |
| Relative P/E vs. FSSTI | 1.4391 |
| Earnings Per Share (SGD) (ttm) | 0.2177 |
| Est. EPS (SGD) (12/2013) | 0.2170 |
| Est. PEG Ratio | 3.5652 |
| Market Cap (M SGD) | 7,170.46 |
| Shares Outstanding (M) | 1,719.53 |
| 30 Day Average Volume | 1,807,833 |
| Price/Book (mrq) | 86.4763 |
| Price/Sale (ttm) | 2.9880 |
| Dividend Indicated Gross Yield | 4.80% |
| Cash Dividend (SGD) | 0.0500 |
| Dividend Ex-Date | 11/13/2013 |
| 5 Year Dividend Growth | 2.13% |
| Next Earnings Announcement | 02/07/2014 |


