


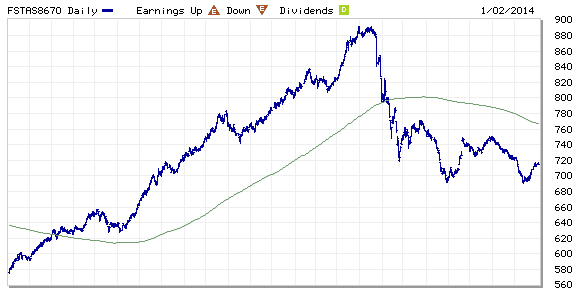
FTSE ST Real Asset Investment Trust (FTSE ST REIT) Index changes from 693.59 to 714.92 compare to last post on Singapore REIT Fundamental Comparison Table on Dec 12, 2013. The index is trading below 200D SMA and technically bearish. The index will be facing resistance at about 730 during the recent rebound. Keep an eye on the Double Bottom formation on FTSE ST REIT Index Chart. This is a potential reversal pattern.
- Price/NAV increases from 0.9748 to 1.001.
- Dividend Yield decreases from 6.50% to 6.34%.
- Gearing Ratio remains at 33.34%.
- In general, most Singapore REIT is at fair value now and the distribution yield is reasonable. However technically Singapore REIT is in the bearish territory and going to drop further if the 690 support (FTSE ST REIT Index Chart) is broken. So don’t be ignorant to think this ...


