


Starhub has been in a Descending Triangle consolidation for about 2 months. The trading range is become narrower and the stock price is getting near to the apex of the triangle. Currently Starhub is trading below the 200D SMA resistance which has started to trend down (a bearish signal). Base on the chart pattern, there are tons of resistances (20D, 50D, 200D, Triangle resistance, 61.8% FR) on the current Starhub price. Starhub has high probability of breaking down from the Descending Triangle (neckline at $4.16) with the price target of $4.00. If $4.00 neckline support is broken, the price target the Head & Shoulders chart pattern is $3.60.
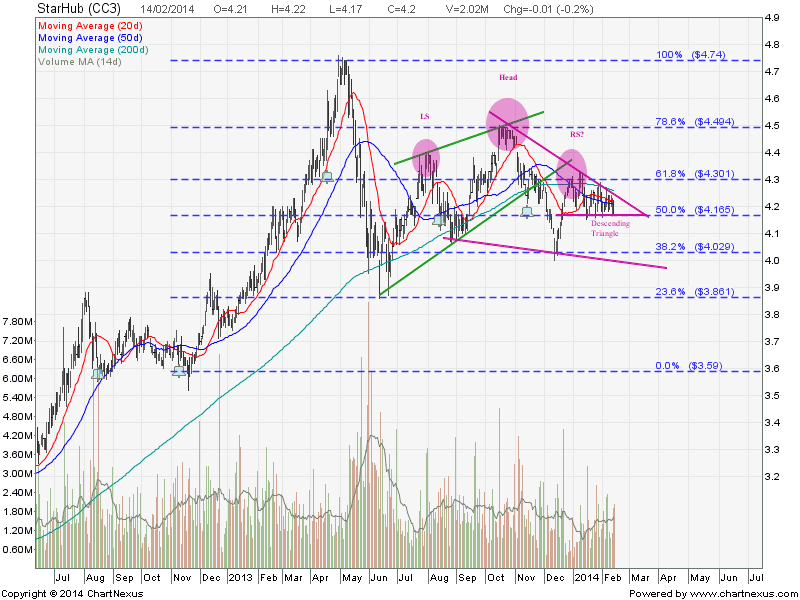
Original post by Marubozu from My Stocks Investing Journey.
Starhub Fundamental Data
| Current P/E Ratio (ttm) | 19.3503 |
|---|---|
| Estimated P/E(12/2014) | 18.7838 |
| Relative P/E vs. FSSTI | 1.5094 |
| Earnings Per Share (SGD) (ttm) | 0.2155 |
| Est. ... |


