


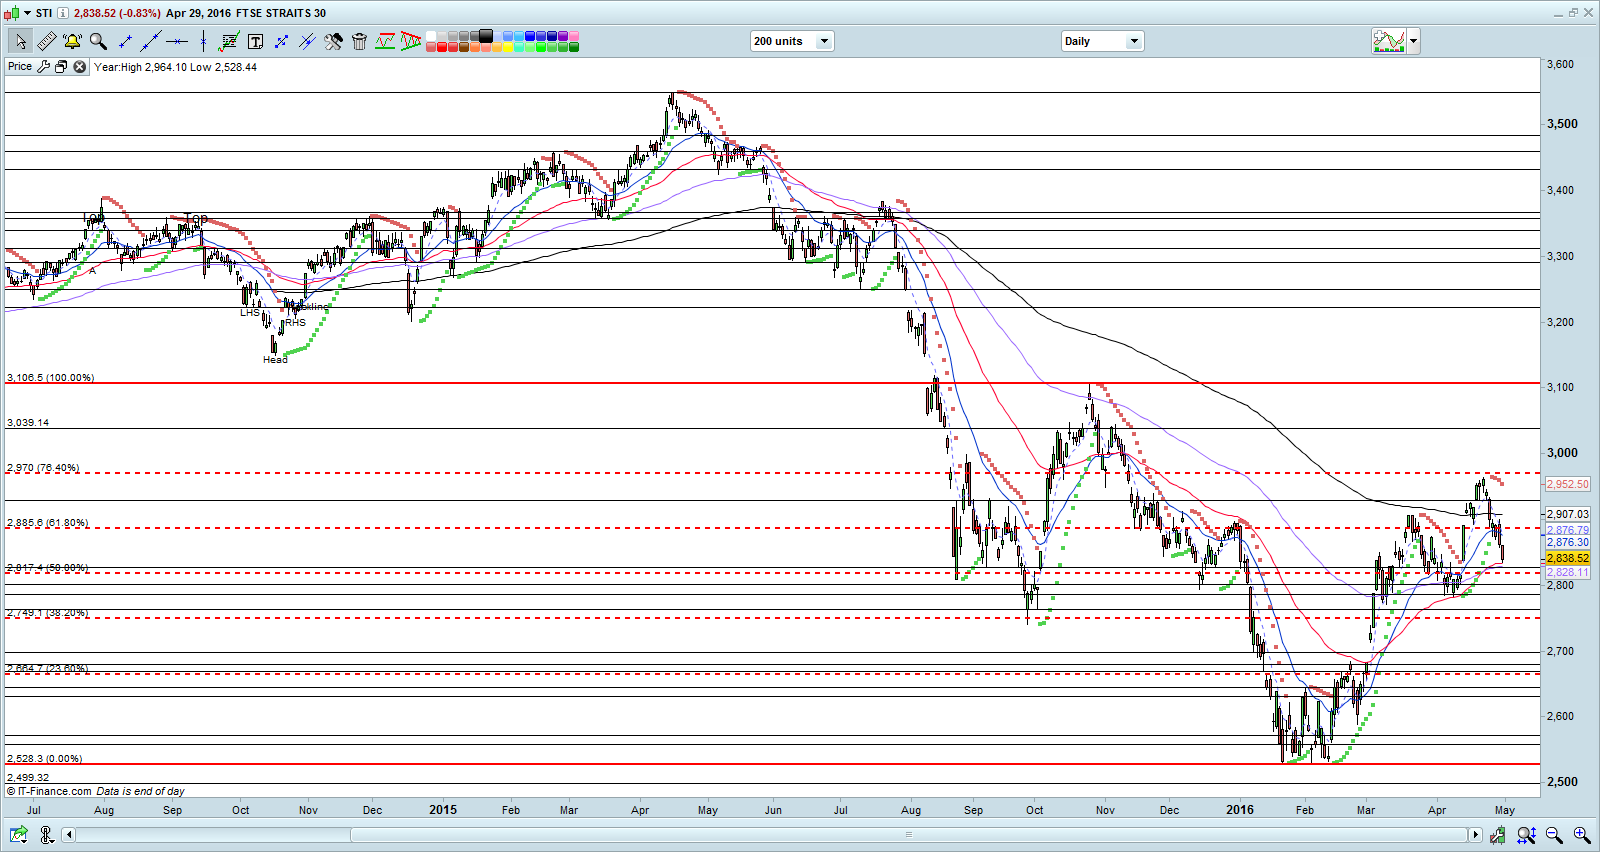
Some of you have missed STI’s sharp 432 points, or 17% rally from the intraday low of 2,532 on 12 Feb 2016 to 2,964 on 21 Apr 2016.
Chart 1: STI’s phenomenal rise since 12 Feb 2016
Source: CIMB complimentary chart as of 29 Apr 2016
Usual reasons of missing this rally are:
a) Fear that market may go down further when it hit 2,532 on 12 Feb. That was the 3rd time it tested 2,529 – 2,532 level;
b) No time to monitor the market but do not wish to place some limit orders due to point a above. Some people thought that they can buy when the market turns up but eventually they did not;
c) No fixed strategy of investing. Entry levels depend on mood, sentiment, time etc.
Since the high of 2,964 on 21 Apr 2016, STI has fallen 125 points, or 4.2% ...
...


