SGX’s Real Estate Developers and Operators have returned 12% YTD, outperforming the STI’s +8%. Despite the rally, the price-to-book ratio of the Sector is still trading near one standard deviation below its historical mean.
Potential drivers for the Singapore property market exist on both the supply and demand front. The biggest Real Estate Developer stocks with substantial Singapore exposure include UOL Group, United Industrial Corporation, Wheelock Properties, Wing Tai Holdings and Bukit Sembawang Estates.
Gains have not just been limited to the STI’s Real Estate stocks. The 20 Real Estate stocks with the largest market capitalisation that are not a part of the STI have all generated gains in the 2017 YTD, averaging 10% total returns.
Over the first six weeks of 2017, Real Estate Management and Development stocks have led the Real Estate Sector, which is a turn from 2016, when Real Estate investment Trusts (REITs) led the Sector. The SGX Real Estate Developers & Operators Index has returned +12.4% in the 2017 year through to the 13 February, outperforming the broader STI’s +8.2% gain. On a 12-month basis, the Index has returned 34.7%, compared to the STI’s 22.5%.
The price-to-book (P/B) ratio of the FTSE ST Real Estate Holding & Development Index (which has a comparatively long history of metrics) is currently at 0.71x. The P/B ratio is used to compare market value to book value and provides a common gauge to determine whether a market may be undervalued or overvalued.
FTSE ST Real Estate Holding & Development Index P/B still below Long Term Average
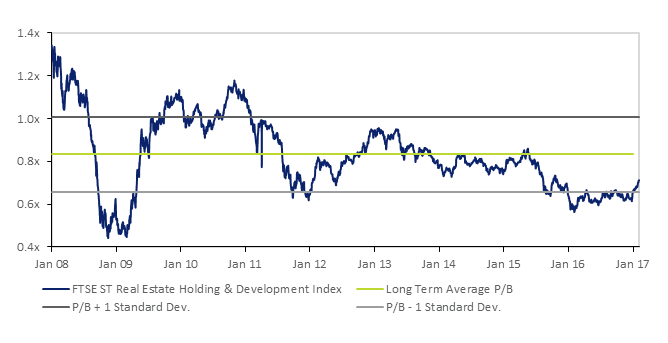
Source: Bloomberg, SGX My Gateway. As of 10 Feb 2017.
Note: FTSE ST Real Estate Holding & Development Index is used to capture historical data before 2011.
As illustrated above, the FTSE ST Real Estate Holding & Development Index P/B ratio spent much of 2016 near or below 0.66x, one standard deviation below the long term average P/B of 0.83x. With the rally over the first six weeks of 2017, the P/B ratio has since moved up to 0.71x, which is still some 17% below the long term average of 0.83x.
Potential Drivers for the Sector
Following the recent rally in the Real Estate Sector, investors’ attention may shift towards the following key metrics for the Singapore property market, which may act as potential catalysts in the upcoming months:
- Stabilisation in private residential property prices – According to Urban Redevelopment Authority (URA), Singapore Private Residential Price Index declined 3.0% year-on-year in 2016. Though the Index has declined 11.2% off the peak in September 2013, the decline was less steep than the -3.7% seen in 2015 and -4.0% in 2014. For 2017, sell-side analysts’ consensus point to a flat to low single-digit decline in prices. URA is scheduled to release preliminary 1Q17 data in early April this year, followed by a final report in late April, which will provide more details on the state of the market.
- Property supply – According to the URA, there were 26,288 private residential and executive condominiums were completed in 2016. The completion rate is forecasted by the agency to go down to 18,307 units this year and 13,785 in 2018. The decline in supply will likely have an impact on vacancy rates. On the office front, office space will likely peak this year before reaching a trough in 2019 (according to URA).
- Interest rates – The three-month Singapore Interbank Offered Rate (SIBOR) has increased by approximately 9 basis points since the conclusion of the U.S. Election to 0.96%. Singapore’s interest rates are sensitive to movements in the United States. As a reminder, the United States Federal Reserve hiked their interest rates on 14 December 2016 and pointed to three further hikes this year. The trajectory of interest rates increase moving forward may also have an impact on demand in the Singapore property market.
- Cooling measures – The Monetary Authority of Singapore (MAS) announced a set of cooling measures back in 2013 to stabilise the local property market. Industry players have been pushing for a relaxation of these measures in recent months and will be focused on next week’s Budget 2017 (20 Feb 2017) where commentary on the property market will be keenly noted.
SGX Real Estate stocks with substantial exposure to the Singapore property market
There are five Real Estate Management & Development stocks with market capitalisation above S$1 billion listed on the SGX with substantial exposure to the Singapore property market. These five companies have returned an average of 14.6% in the year thus far.
Wheelock Properties was the best performing stock of the five with a total return of 26.4%, followed by Wing Tai Holdings (+17.0%), UOL Group (+12.7%), Bukit Sembawang (+10.3%) and United Industrial Corporation (+6.9%). These five stocks are tabled below. Click on each stock to visit its profile page on SGX StockFacts.
Source: SGX, Bloomberg & SGX StockFacts (data as of 13 February 2017)
Strong returns for Real Estate stocks beyond the benchmark STI
There are eight Real Estate Stocks within the Straits Times Index (STI), including three REITs, which have averaged a 12.9% total return in the first six weeks of 2017. The eight stocks were led by Global Logistic Properties (+25.0%), CapitaLand (15.9%) and City Developments (15.8%).
The eight STI Real Estate stocks are tabled below. Click on each stock to visit its profile page on SGX StockFacts.
Source: SGX, Bloomberg & SGX StockFacts (data as of 13 February 2017)
This has not been the full story of the Real Estate Sector – all 20 of the biggest Real Estate stocks that are not within the STI have also gained in 2017. Furthermore, both segments of Real Estate stocks maintain similar dividend yields and price-to-book valuations.
The total returns of the 20 biggest non-STI Real Estate stocks over the first six weeks of 2017 ranged from 32.8% for Oxley Holdings to 2.0% for Keppel REIT. This generated an average total return of 9.9% for the 20 stocks.
Oxley Holdings has a diversified portfolio with property development projects in Singapore, the UK, Cambodia, Malaysia, Ireland, Indonesia and China and investment projects in Singapore, Cambodia, Malaysia and Japan. The Group also provides project management and consultancy services in Myanmar. For the six months ending December 31, 2016 Oxley Holdings reported revenue of S$732.2 million compared to S$613.7 million a year ago, and profit net of tax attributable to owners was S$130.9 million compared to S$83.1 million a year ago.
The 20 largest capitalised Real Estate stocks that are not a part of the STI are tabled below. Click on each stock to visit its profile page on SGX StockFacts.
Source: SGX, Bloomberg & SGX StockFacts (data as of 13 February 2017)
SGX My Gateway
SGX’s investor education portal with market, product and investment information and events. Sign up now at
sgx.com/mygateway to receive our investment updates and economic calendar.
This document is not intended for distribution to, or for use by or to be acted on by any person or entity located in any jurisdiction where such distribution, use or action would be contrary to applicable laws or regulations or would subject SGX to any registration or licensing requirement. This document is not an offer or solicitation to buy or sell, nor financial advice or recommendation for any investment product. This document has been published for general circulation only. It does not address the specific investment objectives, financial situation or particular needs of any person. Advice should be sought from a financial adviser regarding the suitability of any investment product before investing or adopting any investment strategies. Investment products are subject to significant investment risks, including the possible loss of the principal amount invested. Past performance of investment products is not indicative of their future performance. While SGX and its affiliates have taken reasonable care to ensure the accuracy and completeness of the information provided, they will not be liable for any loss or damage of any kind (whether direct, indirect or consequential losses or other economic loss of any kind) suffered due to any omission, error, inaccuracy, incompleteness, or otherwise, any reliance on such information. Neither SGX nor any of its affiliates shall be liable for the content of information provided by third parties. SGX and its affiliates may deal in investment products in the usual course of their business, and may be on the opposite side of any trades. SGX is an exempt financial adviser under the Financial Advisers Act (Cap. 110) of Singapore. The information in this document is subject to change without notice.


