Expectations of a March Federal Reserve rate hike are near 100% as economic data strengthens. Federal Reserve policy rate decision expected on Thursday, 2.00AM, Singapore time.
Cyclical sectors typically have strongest positive correlations to a rising interest rate environment. Singapore banks have generated an average total return of 17.8% (vs STI’s 12.2%) since 8 Nov-16, on the back of strong institutional investors buying activity.
Defensive sectors such as REITs are also sensitive to interest rates. The S-REIT Sector currently offers a yield spread of c430bps, higher than the long-term average of c340bps, which may imply that investors have largely factored in potential rate hikes this year.
Strong Data Boosts Expectations of March Fed Hike
Investor expectations of a March rate hike by the US Federal Reserve has risen considerably. According to Bloomberg’s World Interest Rate Probability (based on futures trading data), expectations of a rate hike rose significantly from 52% at the end of February to almost a 100% today (see chart).
Rising expectations of a rate hike might be attributed to a comment made in early March, where Fed Chair Janet Yellen stated that “it will be appropriate to gradually increase the federal funds rate if the economic data continue to come in about as we expect”. Yellen also pointed out that core inflation (excl. volatile food and energy prices) in the US is at 1.7%, vs the Fed’s target of 2%.
US economic data continues to strengthen as February’s nonfarm payroll report (released last Friday) showed the creation of 235,000 new jobs, beating expectations of a 190,000 increase (according to Reuters). Unemployment rate also declined to 4.7% in February, vs 4.8% in January.
The Fed will hold their Federal Open Market Committee (FOMC) meeting on 14-15 March where analysts expect the benchmark fed funds rates to be raised by 25bps to a range of 0.75%-1.0%. Industry analysts expect three rate hikes over the course of this year. Any decision on a rate hike will be released in a statement by the Fed on Thursday, 2.00AM, Singapore time.
Expectations of a rate hike has spiked up since early March
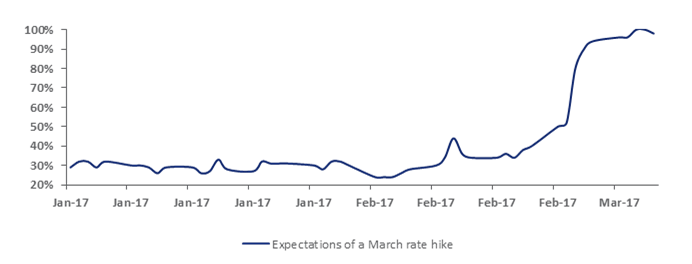
Source: Bloomberg World Interest Rate Probability (data as of 13 March 2017)
Potential Impact of a Rising Interest-Rate Environment
A rising interest-rate environment typically points to improving economic conditions and may have an impact on different equity sectors in the market.
Banks, Industrials, and other cyclical sectors typically benefit from an interest rate cycle. Specifically for banks, net interest margins (NIMs) typically increase from higher interest rates. Cyclical sectors also typically benefit as an improving global economy will likely result in an increase in capital spending.
Conversely, defensive sectors such as real estate investment trusts (REITs), utilities, and telecommunication services have a history of underperforming. These sectors typically have higher dividend yields and rising interest rates may make these sectors less attractive from an investor’s standpoint. Specifically for REITs, higher interest rates may lead to a rise in financing costs, impacting profitability and the ability to acquire assets.
Banks Saw Strong Returns Since November 2016
Singapore banks have an average total return of 17.8% since 8 November 2016, outperforming the STI’s 12.2%. The strong returns are backed by a net buy of S$1.43 billion by institutional investors during the same period (according to SGX data). The three Singapore banks are trading at a price-to-book (P/B) ratio of 1.1x with an ROE of 10.0%.
Strong net buying activities in Financials stocks since Nov-16 (S$M)
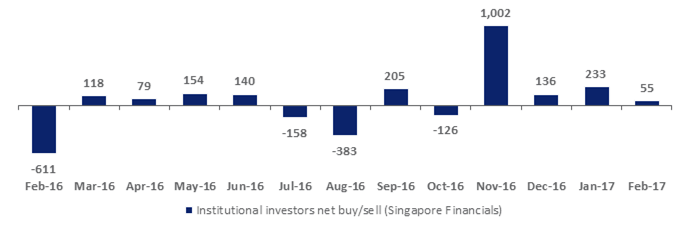
Source: SGX data
Beyond rising interest rates, asset quality remains a focus for Singapore banks in 2017. According to Moody’s Investors Service, Singapore banks saw further decline in profitability and mixed asset quality performance in 2016, but expect pressure on credit costs and net interest margins to subside this year, providing support to profitability.
The table below details the three banks and is sorted by market capitalisation. Click on each stock to visit its profile page on SGX Stock Facts.
| Name |
SGX Code |
Market Cap S$M |
Total Return YTD % |
Total Return 1 Yr % |
Total Return 3 Yr % |
P/E |
P/B |
Dvd Ind Yld % |
ROE % |
| DBS Group Holdings |
D05 |
48,133 |
10.2 |
30.5 |
34.0 |
11.2 |
1.1 |
3.1 |
10.0 |
| Oversea-Chinese Banking Corp |
O39 |
40,001 |
7.7 |
13.8 |
18.2 |
11.6 |
1.1 |
3.7 |
9.9 |
| United Overseas Bank |
U11 |
34,997 |
5.3 |
19.7 |
20.8 |
11.5 |
1.1 |
3.2 |
10.2 |
| Average |
|
|
7.8 |
21.3 |
24.3 |
11.4 |
1.1 |
3.4 |
10.0 |
Source: SGX, Bloomberg & SGX StockFacts (data as of 13 March 2017)
S-REIT Sector Yield Spread & Rate Hike Expectations
Rising interest rates and the steepening of the yield curve typically impact REITs’ distribution per unit (DPUs) due to higher financing costs and may also cap the sector’s price performance.
The Singapore REIT Sector is trading at a forward dividend yield of 6.7% (compared to its five-year historical average of 6.4%) with a price-to-book (P/B) ratio of 1.0x (five-year historical average at 1.0x). When compared to Singapore’s 10-year government bond yield, the sector currently offers a yield spread of c430bps, higher than the longer-term average of c340bps (see chart below). As a reminder, the SGX S-REIT Index has declined 4.8% from the peak in September 2016. This may imply that the investment community has largely factored in the rate hike this year.
SG REIT Sector yield spread at c430bps
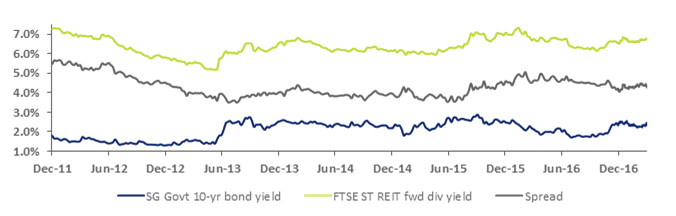
Source: Bloomberg
According to a report by MAS, S-REITs have also improved their debt profiles – where the weighted-average debt maturity in the sector has increased to 3.5 years, from 3.2 years in 2013. Based on MAS analysis, S-REITs appear well-placed to withstand interest rate hikes as they have used derivatives to convert part of their floating-rate borrowings to fixed rates. Stress tests on S-REITs also showed that their median interest coverage ratio (ICR) remains at a healthy ratio of 4.0 after hedging, even when interest rates rise by 3 percentage points. For more information click
here.
S-REITs are relatively less levered, having an average net gearing ratio of 33.3%, which is well below the maximum of 45% as set by the Monetary Authority of Singapore (MAS).
Investors who would like to invest in REITs for sustainable income and long term capital growth can consider the upcoming
NikkoAM-StraitsTrading Asia Ex Japan REIT ETF to be listed on 29 March 2017. The REIT ETF provides a broad exposure to diverse properties sectors across the region (estimated 70% exposure to Singapore listed REITs) and has an indicative net dividend yield of more than 5% per annum. In a recent retail seminar, NikkoAM provided some key points on the impact of rising interest rates on REITs:
- While rising interest rates are a headwind for REITs, most REITs in the Asia ex-Japan REIT ETF have a significant portion of their debts pegged to fixed interest rates (at about 70%)
- Every 100 basis points hike in interest costs is estimated to have a 2% negative impact on annual earnings and dividends. The impact is spread over several years given that a significant portion of the debt is pegged to fixed rates.
- Net profit and DPU are more sensitive to top-line growth than a rise in interest expense. It is estimated that every 1% rise in revenue can offset a 7.6% rise in interest expenses.
For more information on this new REIT ETF, click
here
S-REITs Sorted by Gearing Ratio
The table below details the 38 trusts and is
sorted by gearing ratio. Click on each stock to visit its profile page on SGX Stock Facts.
| Name |
SGX Code |
Market Cap S$M |
Gearing % |
Total Return YTD % |
Total Return 1 Yr % |
Total Return 3 Yr % |
P/B |
Dvd Ind Yld % |
| Cache Logistics Trust |
K2LU |
725 |
42.8 |
2.3 |
5.5 |
-7.7 |
1.0 |
9.1 |
| Sabana Shari'ah Compliant Industrial REIT |
M1GU |
479 |
42.8 |
22.5 |
-8.9 |
-34.2 |
0.6 |
7.7 |
| IREIT Global |
UD1U |
448 |
41.4 |
6.5 |
15.1 |
N/A |
1.1 |
8.6 |
| Mapletree Logistics Trust |
M44U |
2,663 |
39.5 |
6.8 |
16.6 |
28.0 |
1.0 |
7.0 |
| Mapletree GCC Trust |
RW0U |
2,712 |
39.4 |
2.6 |
13.4 |
40.8 |
0.8 |
7.4 |
| Ascott Residence Trust |
A68U |
1,802 |
38.9 |
4.5 |
8.2 |
18.5 |
0.9 |
8.1 |
| OUE Hospitality Trust |
SK7 |
1,224 |
37.8 |
5.1 |
4.7 |
8.6 |
0.9 |
8.0 |
| OUE Commercial REIT |
TS0U |
886 |
37.7 |
1.4 |
9.4 |
17.2 |
0.7 |
7.1 |
| Frasers Hospitality Trust |
ACV |
1,240 |
37.5 |
4.6 |
-1.2 |
N/A |
0.9 |
9.0 |
| Cambridge Industrial Trust |
J91U |
744 |
37.3 |
7.4 |
12.8 |
-1.1 |
0.9 |
7.1 |
| Ascendas REIT |
A17U |
7,119 |
37.1 |
12.4 |
11.2 |
41.7 |
1.2 |
6.3 |
| Soilbuild Business Space REIT |
SV3U |
664 |
37.0 |
1.7 |
-4.3 |
7.7 |
0.9 |
9.9 |
| Viva Industrial Trust |
T8B |
752 |
36.8 |
4.0 |
18.1 |
32.3 |
1.0 |
9.0 |
| CDL Hospitality Trusts |
J85 |
1,380 |
36.6 |
8.7 |
16.4 |
6.2 |
0.9 |
8.0 |
| Manulife US REIT |
BTOU |
743 |
36.6 |
3.1 |
N/A |
N/A |
1.1 |
4.2 |
| Suntec REIT |
T82U |
4,427 |
36.4 |
8.3 |
11.7 |
24.3 |
0.8 |
5.9 |
| Parkway Life REIT |
C2PU |
1,458 |
36.2 |
4.3 |
8.6 |
22.6 |
1.4 |
5.0 |
| Frasers Commercial Trust |
ND8U |
1,002 |
35.9 |
1.2 |
7.7 |
22.7 |
0.8 |
8.0 |
| Mapletree Commercial Trust |
N2IU |
4,235 |
35.1 |
8.1 |
11.1 |
46.5 |
1.1 |
5.6 |
| CapitaLand Retail China Trust |
AU8U |
1,241 |
35.1 |
7.2 |
7.5 |
26.1 |
0.9 |
6.7 |
| Starhill Global REIT |
P40U |
1,592 |
34.8 |
1.0 |
3.9 |
15.5 |
0.8 |
6.9 |
| Far East Hospitality Trust |
Q5T |
1,056 |
33.1 |
-0.6 |
-1.0 |
-11.7 |
0.6 |
7.6 |
| Keppel REIT |
K71U |
3,385 |
32.9 |
2.0 |
10.0 |
7.2 |
0.7 |
5.8 |
| Ascendas Hospitality Trust |
Q1P |
843 |
32.7 |
6.4 |
5.2 |
28.4 |
0.9 |
7.1 |
| CapitaLand Commercial Trust |
C61U |
4,540 |
32.7 |
7.3 |
13.0 |
23.3 |
0.9 |
6.1 |
| AIMS AMP Capital Industrial REIT |
O5RU |
849 |
32.3 |
3.6 |
6.8 |
28.4 |
0.9 |
8.3 |
| CapitaLand Mall Trust |
C38U |
6,860 |
31.8 |
4.5 |
-3.0 |
20.3 |
1.0 |
5.9 |
| Lippo Malls Indonesia Retail Trust |
D5IU |
1,094 |
31.1 |
7.8 |
38.0 |
26.1 |
1.0 |
8.9 |
| First REIT |
AW9U |
992 |
30.8 |
3.7 |
12.8 |
46.1 |
1.3 |
6.6 |
| Keppel DC REIT |
AJBU |
1,296 |
29.7 |
2.4 |
19.1 |
N/A |
1.2 |
4.8 |
| Fortune REIT |
F25U |
2,961 |
29.3 |
-0.8 |
15.3 |
91.1 |
0.7 |
5.8 |
| Frasers Centrepoint Trust |
J69U |
1,807 |
28.3 |
5.7 |
5.3 |
37.1 |
1.0 |
5.8 |
| Mapletree Industrial Trust |
ME8U |
3,010 |
28.2 |
3.0 |
14.4 |
55.8 |
1.2 |
6.8 |
| BHG Retail REIT |
BMGU |
333 |
28.0 |
3.8 |
-11.6 |
N/A |
0.8 |
3.8 |
| Frasers Logistics & Industrial |
BUOU |
1,351 |
27.8 |
3.2 |
N/A |
N/A |
1.0 |
1.9 |
| SPH REIT |
SK6U |
2,464 |
25.5 |
2.4 |
6.4 |
14.8 |
1.0 |
5.6 |
| EC World REIT |
BWCU |
580 |
18.8 |
0.0 |
N/A |
N/A |
N/A |
2.0 |
| Saizen REIT* |
T8JU |
15 |
0.0 |
-43.1 |
-24.6 |
10.6 |
1.7 |
N/A |
| Average |
|
|
33.3 |
3.5 |
7.8 |
22.4 |
1.0 |
6.7 |
Source: SGX, Bloomberg & SGX StockFacts (data as of 13 March 2017)
*Saizen REIT announced that it will not proceed with the proposed RTO transaction between the manager and Sime Darby Property Singapore Limited. For more information click
here.
SGX My Gateway
SGX’s investor education portal with market, product and investment information and events. Sign up now at
sgx.com/mygateway to receive our investment updates and economic calendar.
This document is not intended for distribution to, or for use by or to be acted on by any person or entity located in any jurisdiction where such distribution, use or action would be contrary to applicable laws or regulations or would subject SGX to any registration or licensing requirement. This document is not an offer or solicitation to buy or sell, nor financial advice or recommendation for any investment product. This document has been published for general circulation only. It does not address the specific investment objectives, financial situation or particular needs of any person. Advice should be sought from a financial adviser regarding the suitability of any investment product before investing or adopting any investment strategies. Investment products are subject to significant investment risks, including the possible loss of the principal amount invested. Past performance of investment products is not indicative of their future performance. While SGX and its affiliates have taken reasonable care to ensure the accuracy and completeness of the information provided, they will not be liable for any loss or damage of any kind (whether direct, indirect or consequential losses or other economic loss of any kind) suffered due to any omission, error, inaccuracy, incompleteness, or otherwise, any reliance on such information. Neither SGX nor any of its affiliates shall be liable for the content of information provided by third parties. SGX and its affiliates may deal in investment products in the usual course of their business, and may be on the opposite side of any trades. SGX is an exempt financial adviser under the Financial Advisers Act (Cap. 110) of Singapore. The information in this document is subject to change without notice.


