Singapore lists comparatively more stocks in the GICS® ‘Healthcare Providers and Services’ sub-sector than the global norm, with capitalisation growth outpacing the world.
Singapore's 14 primary listings in the sub-sector generated a 12 month median return of 24% (or 45% average gain excluding new listing HC Surgical Specialists' 115% gain on its initial offer price).
Four of the 14 primary listings - Singapore Medical Group, Health Management International, TalkMed Group and Singapore O&G - exceeded 50% in returns over the past 12 months. The majority of the four stocks reported profit growth for either the 6M or 12M ending 31 Dec 2016 with significant increases in 12M turnover activity.
The world’s 550 stocks categorised as ‘Healthcare Providers and Services’ may seem small amongst the more than 50,000 stocks traded across the world. These 550 stocks make up around one-tenth of the capitalisation of the world’s Healthcare stocks, which in turn make up one-tenth of the world’s market capitalisation.
Yet Singapore and Asia Pacific punch well above their weight when it comes to the range of investing opportunities in the GICS® Healthcare Providers and Services sub-sector. Of the 550 stocks across the world, 240 are primarily listed in Asia Pacific, with 14 primary listings in Singapore. Globally, the sub-sector has doubled in capitalisation over the past 10 years across the world. In Singapore, the expansion was eightfold.
Healthcare providers and services stocks are the owners and operators of health care facilities, including hospitals, nursing homes, rehabilitation centres & animal hospitals. The sub-sector, as defined by GICS®, also includes the owners and operators of Health Maintenance Organisations (HMOs) and providers not elsewhere classified such as dialysis centres, lab testing services, pharmacy management services and business support services.
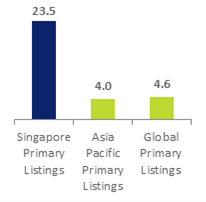
In Singapore, the sub-sector’s 14 primary listings have averaged a 17.8% gain in the 2017 year thus far, bringing their 12 month average return to 45.0%. Over the 12 month period, there were 10 gainers, three decliners and one new listing, HC Surgical Specialists. The less skewed median 12 month return came to 23.5%, which excludes HC Surgical Specialists’ 115% gains from its initial offer price following its debut on 3 November last year.
Comparative Valuations & Performances
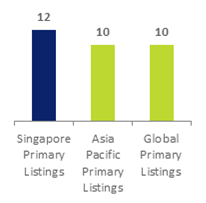
Singapore’s 14 primary-listed Healthcare providers and services stocks have maintained higher median Return-on-Equity (RoE) ratios over the past 12 months than their regional and global peers. At the same time, the sub-sector in Singapore has outperformed peers in median total returns, which includes price returns and dividends.
From a valuation lens, the median Price-to-Earnings (P/E) ratio at 26x is competitive with Asia Pacific, and above the global median at 23x. The median Price-to-Book (P/B) ratio at 3.2x for the Singapore contingent is currently above the regional and global comparatives which are both at 2.4x.
Healthcare Provision and Services - Median Performances
| Median 12M Return %
|
RoE (%) |
P/E (x) |
 |
 |
 |
Source: SGX, Bloomberg, S&P Capital IQ (Data as of 12 April 2017). Note Median values provided due to potential skew impact of outlier performances on average values. Returns in SGD terms.
Strongest Performing Healthcare Providers of the Past Year
In Singapore, four of the Healthcare providers and services stocks generated returns of more than 50% over the past 12 months. These four stocks were Singapore Medical Group, Health Management International, TalkMed Group and Singapore O&G. All four stocks reported stronger financial returns in either the annual or semi-annual reporting periods ending 31 December 2016:
- For the 2016 Financial Year, Singapore Medical Group reported profit attributable to owners of the company at S$2.4 million against a loss attributable to owners of the company of S$148,000 a year ago. The net cash flows generated from operating activities over the FY were S$4,532,000 compared to S$ 360,000 a year ago. Over the 12 months ending March 2017, daily turnover in the stock at S$1.6 million was up 130 times from the preceding 12 months.
- For the six months ending 31 December 2016, Health Management International reported net profit attributable to equity holders of MYR 11.5 million against net profit attributable to equity holders of MYR 6.8 million a year ago. The net cash generated from operating activities was also higher than that in the corresponding period in the previous year. Over the 12 months ending March 2017, daily turnover in the stock at S$597,000 was up 13 times from the preceding 12 months.
- For the 2016 Financial Year, TalkMed Group reported profit attributable to owners of the company at S$37.4 million, compared to S$37.3 million a year ago. Net cash flows from operating activities were S$44.8 million compared to S$40.4 million a year ago. Basic and fully diluted earnings per share were 5.69 cents compared to 5.68 cents a year ago. Over the 12 months ending March 2017, daily turnover in the stock at S$51,000 was up almost three times from the preceding 12 months.
- For the 2016 Financial Year, Singapore O&G reported profit of S$8.8million or 3.69 cents per basic and diluted share against profit of S$5.3 million or 2.24 cents per basic and diluted share a year ago. The net cash generated from operating activities came to S$10.4 million, compared to S$6.4 million a year ago. Over the 12 months ending March 2017, daily turnover in the stock at S$244,000 was consistent with the preceding 12 months.
This turnover increases for three of these four stocks were well beyond the increases of their respective share prices, reflective of increased investor participation in the four stocks.
Overall Sector Performance
Beyond Singapore’s 14 Healthcare providers and services stocks, SGX also list the secondary listing of IHH Healthcare Berhad in addition to China Medical International Group which diversified from metals distribution to aesthetic medical and healthcare services in 2015. The 14 primary listings, in addition to IHH Healthcare Berhad in addition to China Medical International Group are tabled below. To see more details on each stock in SGX StockFacts, click on the stock name.
Singapore’s Primary Listings in the GICS® Health Care Providers & Services Sub-Sector
Secondary Listings & Stocks with Significant Health Care Providers & Services Business
| Name |
SGX Code |
Market Cap S$M |
Price S$ |
Total Return YTD % |
Total Return 12M % |
Dvd Ind Yld % |
P/E |
P/B |
ROE % |
| IHH Healthcare |
Q0F |
15,640 |
1.900 |
-11.2 |
-15.9 |
0.5 |
81.2 |
2.2 |
2.8 |
| China Medical Intl Group |
5IB |
19 |
0.006 |
-45.5 |
-45.5 |
N/A |
N/A |
6.5 |
-183.6 |
Source: SGX, Bloomberg & SGX StockFacts (data as of 12 April 2017).
Note: All stocks a primary listings representing the GICS® Health Care Providers and Services sub-sector, with exception of IHH Healthcare Berhad which is a secondary listing within the sub-sector and China Medical Intl Group which is still categorised to the Industrials Sector.
Note Religare Healthcare Trust can be alternatively categorised to Property Trusts & TechComp can be alternatively categorised to distributors and wholesalers of healthcare products .
As discussed in the SGX My Gateway Newsletter (click
here) the Healthcare Sector was the least performing sector in Singapore for the first quarter of 2017. This was due to declines of the biggest stock of the Sector, IHH HealthCare Berhad, which make up approximately half of the market-capitalisation weighted returns of the Sector.
By comparison, the SGX All Healthcare Index which caps the impact of IHH Healthcare Berhad at each rebalance to 10%, generated a 3.0% total return over the first quarter. This was a positive contribution to the 15.0% performance of the SGX All Healthcare Index over the past 12 months.
IHH HealthCare Berhad
While IHH HealthCare Berhad has declined 15.7% over the past 12 months, the stock has generated a 73% total return for investors since listing in July 2012. The secondary listing is supported by local market makers who provide both continuous bids and offers in the stock throughout the trading session. For example at the time of writing, the stock had 30,000 shares on the bid and S$1.900, and 3,100 shares on the offer at S$1.910 and 7000 shares on the offer at S$1.915. Up to S$1.930, there were a total of 44,000 shares on the offer. Investors that wish to trade more than S$50,000 in one transaction can contact their broker who may facilitate block trading.
HC Surgical Specialists
While IHH HealthCare Berhad is the biggest stock of the Sub-sector, the most recent stock to list in this segment was HC Surgical Specialists. The company provides endoscopic procedures through a network of clinics in Singapore. It offers endoscopic procedures, including gastroscopies, colonoscopies, and general surgery services with a focus on colorectal procedures. The stock has gained 115% from its 27 cents IPO price.
Sector Drivers
Multiple opportunities and challenges exist in the supply and demand for healthcare services across Asia. On the demand side, Asia’s population is growing as is longevity. On the supply side, Asia’s number of doctors, nurses, hospitals and medical equipment diverge across the region, and still trail the per capita averages of the 34 OECD member countries. With limited fiscal funding covering a range of sectors beyond healthcare, there is an increasing role for corporations to engage these opportunities and challenges.
SGX My Gateway
SGX’s investor education portal with market, product and investment information and events. Sign up now at
sgx.com/mygateway to receive our investment updates and economic calendar.
This document is not intended for distribution to, or for use by or to be acted on by any person or entity located in any jurisdiction where such distribution, use or action would be contrary to applicable laws or regulations or would subject SGX to any registration or licensing requirement. This document is not an offer or solicitation to buy or sell, nor financial advice or recommendation for any investment product. This document has been published for general circulation only. It does not address the specific investment objectives, financial situation or particular needs of any person. Advice should be sought from a financial adviser regarding the suitability of any investment product before investing or adopting any investment strategies. Investment products are subject to significant investment risks, including the possible loss of the principal amount invested. Past performance of investment products is not indicative of their future performance. While SGX and its affiliates have taken reasonable care to ensure the accuracy and completeness of the information provided, they will not be liable for any loss or damage of any kind (whether direct, indirect or consequential losses or other economic loss of any kind) suffered due to any omission, error, inaccuracy, incompleteness, or otherwise, any reliance on such information. Neither SGX nor any of its affiliates shall be liable for the content of information provided by third parties. SGX and its affiliates may deal in investment products in the usual course of their business, and may be on the opposite side of any trades. SGX is an exempt financial adviser under the Financial Advisers Act (Cap. 110) of Singapore. The information in this document is subject to change without notice.