Singapore’s Electronics cluster (27.4% of total manufacturing activity) demonstrates strong momentum with its 13th consecutive month of YoY output growth.
SGX’s IT Sector is an outperformer in the YTD with total returns of 33.3%, above the STI’s +11.1% and the MSCI Asia ex-Japan IT Index’s +18.4%.
Strong earnings outlook likely the key driver of IT Sector’s outperformance. Consensus expects 10 largest IT stocks* to grow earnings by 20% in 2017.
Electronics Manufacturing Output Momentum Remains Strong
Singapore’s Electronics cluster has started 2017 on a bright note, continuing its strong manufacturing output momentum. Data from Economic Development Board (EDB) showed that Singapore’s Electronics cluster’s March manufacturing output expanded by 37.7% YoY (driven by Semiconductor cluster’s +54.6% YoY). This performance resonates with robust global semiconductor sales in March, which grew 18.1% YoY (largest increase since October 2010) – click
here.
The strong momentum contributed to Singapore’s overall manufacturing output in March (+10.2% YoY), beating economists’ expectations of +7.1% (according to a Reuters poll). As a reminder, the Electronics cluster is a major contributor of Singapore’s total manufacturing activity with a 27.4% weightage.
Singapore Electronics cluster sees 13th consecutive month of YoY output growth, with Semiconductor sub-segment experiencing even more robust expansion rates.
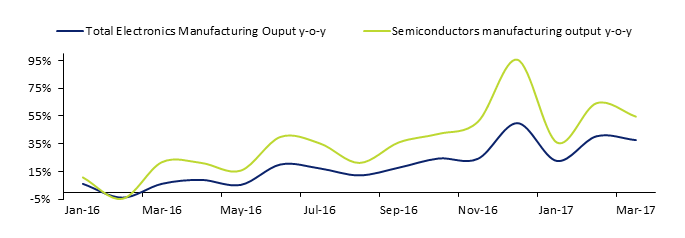
Source: Economic Development Board (EDB) Singapore
Singapore IT Sector’s YTD total returns (+33.3%) Outperformed Regional Benchmark (+18.4%)
As the industry continues to see positive data-points, it is not surprising that the Information Technology (IT) Sector was the top-performing Sector in the year-to-date (YTD). Specifically, SGX’s IT Sector generated a capitalisation weighted total return of 4.9% in April, bringing YTD gains to 33.3% (click
here for more details). This is higher than the Straits Times Index’s (STI) total return of 11.1% and the regional benchmark’s (MSCI AC Asia ex-Japan IT Index) total return of 18.4% (or +22.6% in USD terms) over the same period.
10 Largest IT Stocks* to Grow Earnings 20% in 2017 and 12% in 2018
Post the YTD rally, the 10 largest IT stocks (which have sell-side analyst coverage) are trading at an average trailing price-to-earnings (P/E) ratio of 17.6x. However, on a forward (full-year 2017) basis, the average P/E is much lower at 14.6x. These 10 stocks have returned 53.4% in the YTD thus far.
The lower forward P/E can be attributed to the growth expectations of these companies estimated by sell-side analysts. In fact, by using a price/earnings to growth (PEG) ratio, seven out of these 10 companies are trading at below 1.0x. As a general rule of thumb, a PEG ratio of 1.0x indicates that a stock is fairly valued when compared to the expected earnings growth. A PEG ratio lower than 1.0x may also indicate that the stock is undervalued and
vice versa.
According to data from Bloomberg, consensus expects these 10 companies to grow EPS by a median of 19.9% in 2017 and another 11.7% in 2018. The strong earnings outlook is likely one of the factors driving the IT Sector’s return in the YTD.
The 10 largest IT stocks (which have sell-side analyst coverage) are listed below, sorted by market capitalisation. Click on each stock to visit its profile page on SGX StockFacts.
| Name |
SGX Code |
Market Cap S$M |
Price Last Close S$ |
P/E (x) |
P/E: Forward (x)** |
PEG (x)*** |
2017 Consensus EPS growth % |
2018 Consensus EPS growth % |
| Venture Corp |
V03 |
2,283 |
12.83 |
18.4 |
16.5 |
0.820 |
20.1 |
9.1 |
| Silverlake Axis |
5CP |
1,460 |
0.54 |
8.0 |
18.6 |
-1.089 |
-17.1 |
-34.5 |
| iFAST Corp |
AIY |
303 |
0.775 |
32.7 |
27.7 |
0.742 |
37.3 |
14.3 |
| UMS Hldgs |
558 |
264 |
0.88 |
16.7 |
14.0 |
0.705 |
19.8 |
4.8 |
| Nera Telecom. |
N01 |
230 |
0.39 |
31.8 |
16.3 |
-0.186 |
-87.6 |
50.0 |
| CSE Global |
544 |
214 |
0.505 |
12.3 |
11.5 |
1.617 |
7.1 |
9.1 |
| Valuetronics Hldgs |
BN2 |
174 |
0.84 |
12.6 |
12.7 |
0.806 |
15.8 |
9.1 |
| TeleChoice Intl |
T41 |
118 |
0.255 |
15.2 |
11.6 |
0.384 |
30.2 |
18.2 |
| Serial System |
S69 |
112 |
0.177 |
8.2 |
8.4 |
0.027 |
311.8 |
19.0 |
| AEM Hldgs |
AWX |
22 |
2.62 |
19.9 |
9.0 |
0.029 |
309.2 |
17.2 |
| Average |
|
|
|
17.6 |
14.6 |
|
|
|
| Median |
|
|
|
|
|
|
19.9 |
11.7 |
Source: SGX, Bloomberg & SGX StockFacts (data as of 9 May 2017)
Forward P/E based on full-year 2017 EPS
| Name |
SGX Code |
Total Return YTD % |
Total Return 1 Yr % |
Total Return 3 Yr % |
Dvd Ind Yld % |
GICS® Sub-Industry Name |
| Venture Corp |
V03 |
29.9 |
55.5 |
100.1 |
3.8 |
Electronic Manufacturing Services |
| Silverlake Axis |
5CP |
3.1 |
3.1 |
-17.3 |
5.2 |
Application Software |
| iFAST Corp |
AIY |
-6.4 |
-30.8 |
N/A |
3.6 |
Internet Software & Services |
| UMS Hldgs |
558 |
49.0 |
55.3 |
60.0 |
5.7 |
Semiconductor Equipment |
| Nera Telecom. |
N01 |
-1.3 |
-16.6 |
-17.3 |
2.6 |
Communications Equipment |
| CSE Global |
544 |
14.3 |
28.7 |
-1.4 |
5.6 |
IT Consulting & Other Services |
| Valuetronics Hldgs |
BN2 |
61.5 |
95.7 |
213.4 |
4.3 |
Electronic Manufacturing Services |
| TeleChoice Intl |
T41 |
2.1 |
4.1 |
27.0 |
6.3 |
Technology Distributors |
| Serial System |
S69 |
24.9 |
44.9 |
47.2 |
1.9 |
Technology Distributors |
| AEM Hldgs |
AWX |
357.0 |
709.6 |
419.0 |
0.5 |
Semiconductor Equipment |
| Average |
|
53.4 |
95.0 |
92.3 |
3.9 |
|
Source: SGX, Bloomberg & SGX StockFacts (data as of 9 May 2017)
*Based on the largest IT stocks with analyst coverage
**Forward P/E based on full-year 2017 EPS
***Calculated by dividing “P/E: Forward” over “2017 Consensus EPS growth”
IT Stocks Comprises 10% of SGX’s Securities Market
There are 76 stocks listed on the SGX which are classified under the IT sector (based on MSCI GICS® Categorisations), accounting for approximately 10% of SGX’s securities market. These 76 stocks have a combined market capitalisation of more than S$12 billion. The sector comprises companies that offer software and IT services, manufacturers and distributors of technology hardware and equipment such as communications equipment, cellular phones, computers & peripherals, electronic equipment as well as related instruments and semiconductors.
SGX My Gateway
SGX’s investor education portal with market, product and investment information and events. Sign up now at
sgx.com/mygateway to receive our investment updates and economic calendar.
This document is not intended for distribution to, or for use by or to be acted on by any person or entity located in any jurisdiction where such distribution, use or action would be contrary to applicable laws or regulations or would subject SGX to any registration or licensing requirement. This document is not an offer or solicitation to buy or sell, nor financial advice or recommendation for any investment product. This document has been published for general circulation only. It does not address the specific investment objectives, financial situation or particular needs of any person. Advice should be sought from a financial adviser regarding the suitability of any investment product before investing or adopting any investment strategies. Investment products are subject to significant investment risks, including the possible loss of the principal amount invested. Past performance of investment products is not indicative of their future performance. While SGX and its affiliates have taken reasonable care to ensure the accuracy and completeness of the information provided, they will not be liable for any loss or damage of any kind (whether direct, indirect or consequential losses or other economic loss of any kind) suffered due to any omission, error, inaccuracy, incompleteness, or otherwise, any reliance on such information. Neither SGX nor any of its affiliates shall be liable for the content of information provided by third parties. SGX and its affiliates may deal in investment products in the usual course of their business, and may be on the opposite side of any trades. SGX is an exempt financial adviser under the Financial Advisers Act (Cap. 110) of Singapore. The information in this document is subject to change without notice.