


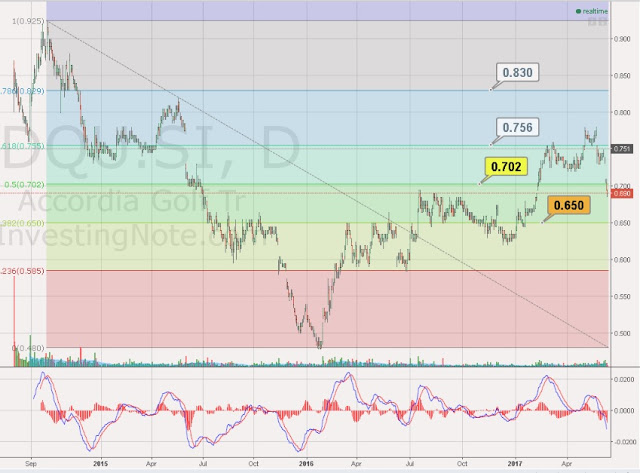
Fibonacci RetracementAs usual, I am not an expert in Technical tools. We can however try to use this to time our trade after FA. As dividend investor, getting in low enough is important so that we have a better pie in DPU and Capital gains if any.
Using Fibonacci Retracement can be one of a good way but surely not always the right way. Here's what i found on this Indicator definition. In technical analysis, Fibonacci retracement is created by taking two extreme points (usually a major peak and trough) on a stock chart and dividing the vertical distance by the key Fibonacci ratios of 23.6%, 38.2%, 50%, 61.8% and 100%. Once these levels are identified, horizontal lines are drawn and used to identify possible support and resistance levels.
Thanks to Investing Note again which provide free charting and customization for my learning. https://www.investingnote.com
Again, ...
...


