In the 2017 YTD Yangzijiang Shipbuilding was the best performing STI stock with a 45% price gain, after ranking as the STI’s least performer in 2016. At the same time, the STI’s least performer in the 2017 YTD, Golden Agri Resources, was the best performing STI stock in 2016.
The STI’s five Real Estate Management and Development stocks have averaged a 24% price gain in the year-to-date, with three of the stocks making the top five performing STI stocks in the 2017 year-to-date. Yanlord Land, which recently joined the STI Reserve List has gained 35% in the 2017 YTD.
Of the nine STI stocks & three STI Reserve Stocks that maintain dividend yields of 4.0% or higher, the three best price performers in the 2017 YTD were Ascendas REIT, Singapore Technologies Engineering and Keppel REIT.
The Straits Times Index (STI) has generated a 11.9% price gain in the 2017 year-to-date, which compares to an average of 6.5% in SGD terms for the benchmarks of Indonesia, Thailand and Malaysia, and an average of 9.0% in SGD terms for the benchmarks of Japan and Hong Kong.
| 2017 STI & Regional Benchmark Average Price Returns (%) |
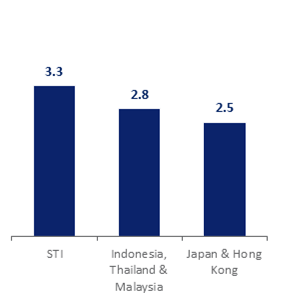
2017 STI & Regional Benchmark Average Dividend Yields Returns (%) |
 |
 |
Source: SGX StockFacts, Bloomberg (Data as of 2:30pm 27 June 2017)
The STI has one of the highest dividend yields across Asia with the yield at 3.3% as of 27 June 2017. This compared to an average of 2.8% for the Jakarta Composite Index, FTSE Malaysia KLCI and the Stock Exchange of Thailand Index. The average indicative dividend yield of the Nikkei 225 and the Hang Seng Index is 2.5%.
STI Stocks
The best performing STI constituent in the 2017 year-to-date, Yangzijiang Shipbuilding Holdings, was also the least performing STI stock in 2016. Contrariwise, the least performing STI constituent in the 2017 year-to-date, Golden Agri Resources, was the best performing STI stock in 2016. Yangzijiang Shipbuilding Holdings has generated a 45% price gain in the 2017 year-to-date, following on from its 26% decline in 2016. Meanwhile Golden Agri-Res has declined 13% in price in the 2017 YTD, after gaining 27% in 2016.
This is a relatively straightforward example of an turnaround in the ranking of STI stock performances. It does not mean underperformers necessarily become outperformers and vice versa. It simply exemplifies that in the recent past, stock rotation opportunities have existed beyond the STI’s benchmark returns. Rotation criteria can involve different stocks, sectors, a different geographical focus or style factors such as dividend or value.
STI Sectors
Last year Consumer Staples was the strongest segment within the STI, with all three Consumer Staples stocks making the top performing five STI stocks of 2016. While the first half of 2017 has three and a half sessions remaining, it has been a different segment of the STI that has been the best performer over the period. The STI’s five Real Estate Management and Development stocks have averaged a 23.5% price gain in the year-to-date, with three of the stocks making the top five performing STI stocks in the 2017 year-to-date. In 2016, the five stocks averaged a price decline of 2.2%. The STI Reserve List also includes one Real Estate Management & Development stock, Yanlord Land, which has also been the strongest of the five reserve stocks in the 2017 year-to-date.
The list of 30 STI stocks and the respective performances in the year-to-date in addition to 2016 are tabled below. The SGD equivalents are provided for Jardine Matheson Holdings, Hongkong Land Holdings and Hutchison Port Holdings Trust. Note that the latter can be traded in both USD and SGD currencies.
Source: SGX StockFacts, Bloomberg (Data as of 23 June 2017)
Source: SGX StockFacts, Bloomberg (Data as of 23 June 2017)
SGX My Gateway
SGX’s investor education portal with market, product and investment information and events. Sign up now at
sgx.com/mygateway to receive our investment updates and economic calendar.
This document is not intended for distribution to, or for use by or to be acted on by any person or entity located in any jurisdiction where such distribution, use or action would be contrary to applicable laws or regulations or would subject SGX to any registration or licensing requirement. This document is not an offer or solicitation to buy or sell, nor financial advice or recommendation for any investment product. This document has been published for general circulation only. It does not address the specific investment objectives, financial situation or particular needs of any person. Advice should be sought from a financial adviser regarding the suitability of any investment product before investing or adopting any investment strategies. Investment products are subject to significant investment risks, including the possible loss of the principal amount invested. Past performance of investment products is not indicative of their future performance. While SGX and its affiliates have taken reasonable care to ensure the accuracy and completeness of the information provided, they will not be liable for any loss or damage of any kind (whether direct, indirect or consequential losses or other economic loss of any kind) suffered due to any omission, error, inaccuracy, incompleteness, or otherwise, any reliance on such information. Neither SGX nor any of its affiliates shall be liable for the content of information provided by third parties. SGX and its affiliates may deal in investment products in the usual course of their business, and may be on the opposite side of any trades. SGX is an exempt financial adviser under the Financial Advisers Act (Cap. 110) of Singapore. The information in this document is subject to change without notice.


