


Before we know it, it’s the halfway mark of FY17 and it’s time for the customary crunching of numbers to see where TTI stands, relative to the general market.
To summarize: Not too good.
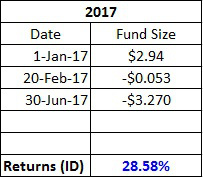
STI ETF’s figures are kinda crazy this year, and although in recent weeks STI is showing some weakness, on an annualized basis it is still on a tear.
Clocking in with an XIRR of 28.58% at the halfway mark, STI ETF continues it’s impressive run in 2017.
By contrast, TTI’s XIRR for 2017 stands at 12.81% as of 2017Q2.
Total portfolio size has increased rather rapidly though, from $943,815.80 as of the start of the year, to $1,201,907.53.
Of this increase of $258,091.73 since 6 months ago, $194,600.89 is accounted for by capital infusion, while $63,490.84 comes from capital gains.
Seeing little to no attractive opportunities in the ...
...


