


Done with writing another R script! Instead of correlating different counters together, this time round my script will be used to visualize the trend in dividend yield across time. I'm particularly curious as to the yield of some counters during the great financial crisis (GFC). It's more for planning how I could prioritize my available funds.
The function takes in three arguments: (a) the counter symbol, (b) the start date, and (c) the end date.
The function consists of the following steps:
1). Use quantmod to import the historical data for a given counter into R, with the start date and the end date specified by the user.
2). Retain only the closing price for said counter
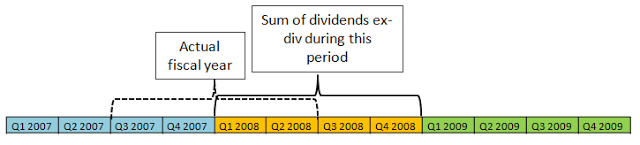
3). Use quantmod to download the dividend data, and their corresponding payout dates, into R. The start date and the end date are the same as that in step 1.
4). Sum up the dividends ......


