


Published on 9/11/2017 by www.smartinvestorinc.com
Source: IT-Finance as of 9/11/2017 |
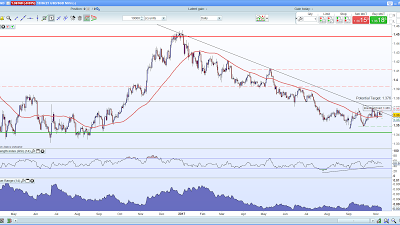
The USD/SGD Pair could be testing their downtrend line established since the start of 2017. A breakout point will be around 1.365 and we will need a close from the daily chart to affirm a breakout. A potential target after the breakout will be the 1.376 level.
At the moment it is consolidating between 1.36 to 1.365 region. A daily close below 1.358 level would derail this potential bullish setup.
From the fundamental angle, US is likely to carry on their rate hike policy thou in a measured manner. Dec 12-and 13 will be the next Federal Reserve Meeting whereby a rate hike will be expected.
Disclaimer:
The information contained in this publication is provided to you for general information only and is not intended to nor will it create/induce the creation of ......


