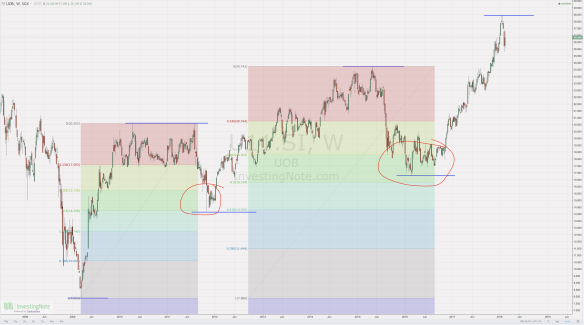
Weekly Chart Analysis – Price action on the stock indicates that it is in an overall bull trend ( started in 2009 ), making higher highs and higher lows. Something I spotted was that market tends (high probability) to retrace to the 0.5 area before moving higher.
Current price action indicates a probable retracement more than a continuation of the trend.
Daily Chart Analysis – Differs a lot from the weekly chart, where it shows that price action has recently respected previous structure low (maintaining the trend characteristic). The market still has a leg room to prove the retest, hence an entry now wouldn’t be a wise one ......