


Dear all,
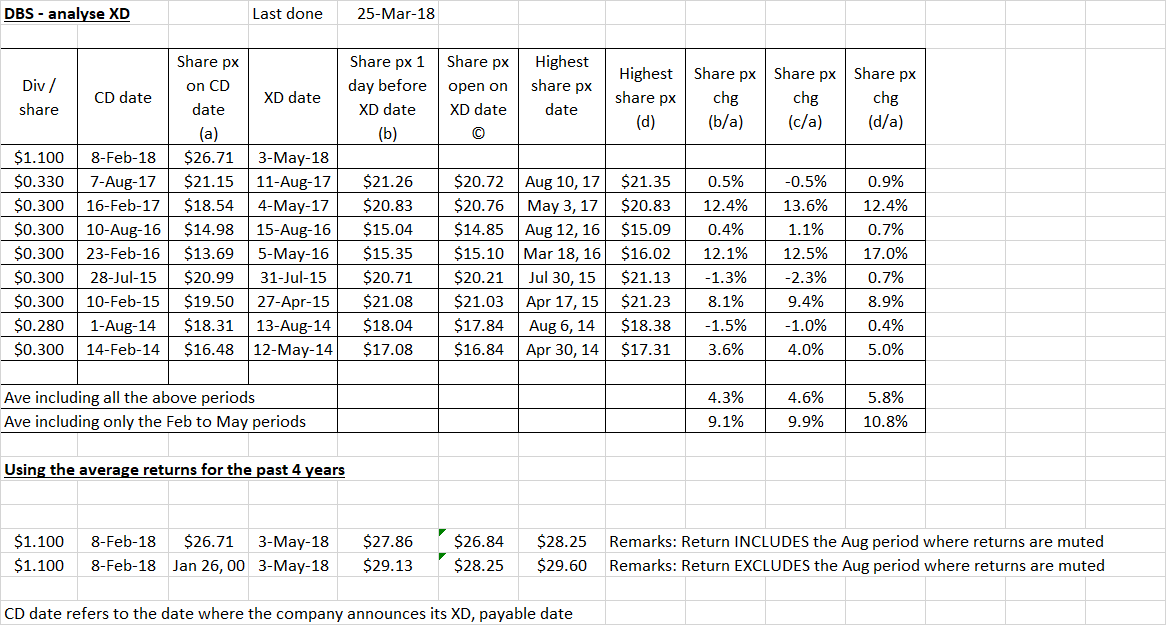
Based on a simple tracking of DBS’ share price performance from CD to XD, on average, DBS seems to move approximately 4-9% above its CD price, nearer to XD (translating to around S$27.86-29.13). See Table 1 below. DBS is going to XD $1.10 on 3 May.
Table 1: DBS’ share price performance from CD to XD
Source: Ernest’s compilations
What are the analysts saying?
Based on Figure 1 below, average analyst target is around $31.15. At $27.21, this represents a potential capital upside of around 14.5%. Estimated div yield is around 4.1%. There are 17 buy; 6 hold and no sell calls.
Figure 1: DBS’ analyst compilation by Bloomberg
Source: Bloomberg 26 Mar 18
How does DBS’ chart look?
Based on Chart 1, DBS has dropped $2.50, or 8.4% from an intraday high of $29.71 ...
...


