


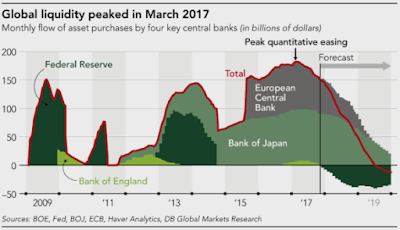
The chart above depicts very clearly the QE program by the world's major central bank since the global financial crisis of 2009. The flood of liquidity exceeds trillions of dollars. We can also see that the bulk of the liquidity was created after 2011 by the Bank of Japan and the European Central Bank.
Hence while the US is tapering, the decline in liquidity is negligible when compared to the mountains of monies created over the last nine years. This great flood of cheap money is the reason for many phenomena that we are seeing including unicorn startups and the ever-increasing dollar psf of prime properties in global cities.
Why didn't Singapore property fall back to S$1,000 psf? That's because we are thinking in nominal terms. Our minds work best in nominal terms, we like to compare psf today vs psf in 2008 vs psf in 1998 thinking it's the ......


