


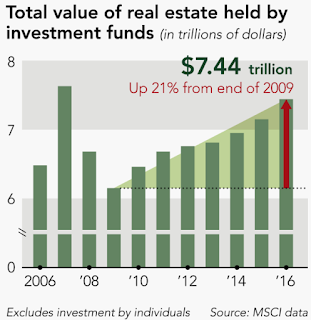
Here's another chart that explains why property keeps rising, globally. Since the Global Financial Crisis of 2009, the central banks flooded the world with liquidity to prevent a Great Depression type catastrophe. But this created heaps of cheap money in the system, which had to find its way into assets. Hence private equity, bitcoins, art, wine and needless to say, property. $7.4trn into real estate in no joke. This is larger than Japan's economy and almost as large as China's economy. It is a wonder now why Singapore property doesn't correct enough for you to buy? URA property price index charts The charts above are published by URA and the last few data points showed how the cycle has turned. At the peak of c.150 (top chart), prices fell less than 20% to c.135 for five long years before turning up again. Did it actually correct?...


