Technical Analysis
STI Analysis — the next peak and trough ? (22)
By ccloh Strategic Investor Zone  •  August 13, 2018
Continued from STI Analysis -- the next peak and trough ? (21) 
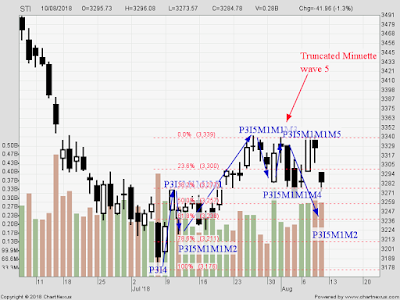
The failure of STI to breakout from 3340 meant STI still in Minute wave 2 (P3I5M1M2).  This has a potential downside of 3238 for a 61.8% Fibonacci Retracement.  However, looking at the volume on a down day, a 78.6% Fibonacci Retracement to 3211 look possible too.  Anything below 3211 raise the possibility of invalidation of Scenario 1 and 2.1.  The above is the optimistic view of Elliott Wave count of STI. The above chart is the pessimistic view for Elliott Wave count of STI.  The is the Scenario 3 which was first mentioned in STI Analysis -- the next peak and trough ? (IV) and highlighted again in STI Analysis -- the next peak and trough ? (18).  This is the case when STI still in the correction phase which started end ......
Read the full article
By ccloh Strategic Investor Zone
Am a typical retail investor who started investing in stock market in 1993, the same length of period as SingTel was listed in SGX and ironically SingTel was my first vested stock. Back then was a passive investor and started to turn more active in stock market in 2006. A year later when I switched my engineering job to a finance related one, I became what commonly known as trader ( trade for living ) and at the same time also strongly believe in fundamental/value investing that is the way to growth wealth. In a way I classify myself as a "Strategic Investor". As a trader, I track market movement daily and as an value investor, I am always on the lookout for cheap bargain to hold for long term.
LEAVE A COMMENT
LEAVE A COMMENT

Your email address will not be published.

*

Your Email Address will not be published
*

Read More Articles
More from thefinance