


Have been tracking Creative Technology since the price fell from $10. Was curious then whether the correction from $10 followed any Elliott Wave pattern. After all not all stocks' price performance follow Elliott Wave. Initially, it didn't seem like it but as the correction progress from June 2018 onward, the pattern seems more and more following an Elliott Wave pattern.
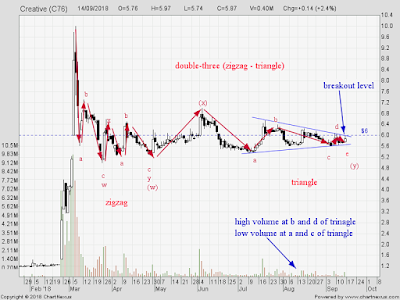
The above chart shows how the correction has been played out with a Double-three combination of zigzag - triangle and price action is at the end of the correction should it follow Elliott Wave.
The first part of the Double-three combination, zigzag was the unsure part initially that it follows Elliott Wave. Normally, a zigzag pattern which is a 5-3-5 pattern is formed by a 5-wave impulse/diagonal for wave A, a zigzag for wave B and another 5-wave impulse/diagonal for wave C. In the above ...
...


