STI Analysis — the next peak and trough ? (33)
By ccloh Strategic Investor Zone  •  November 17, 2018
Continued from STI Analysis -- the next peak and trough ? (32)

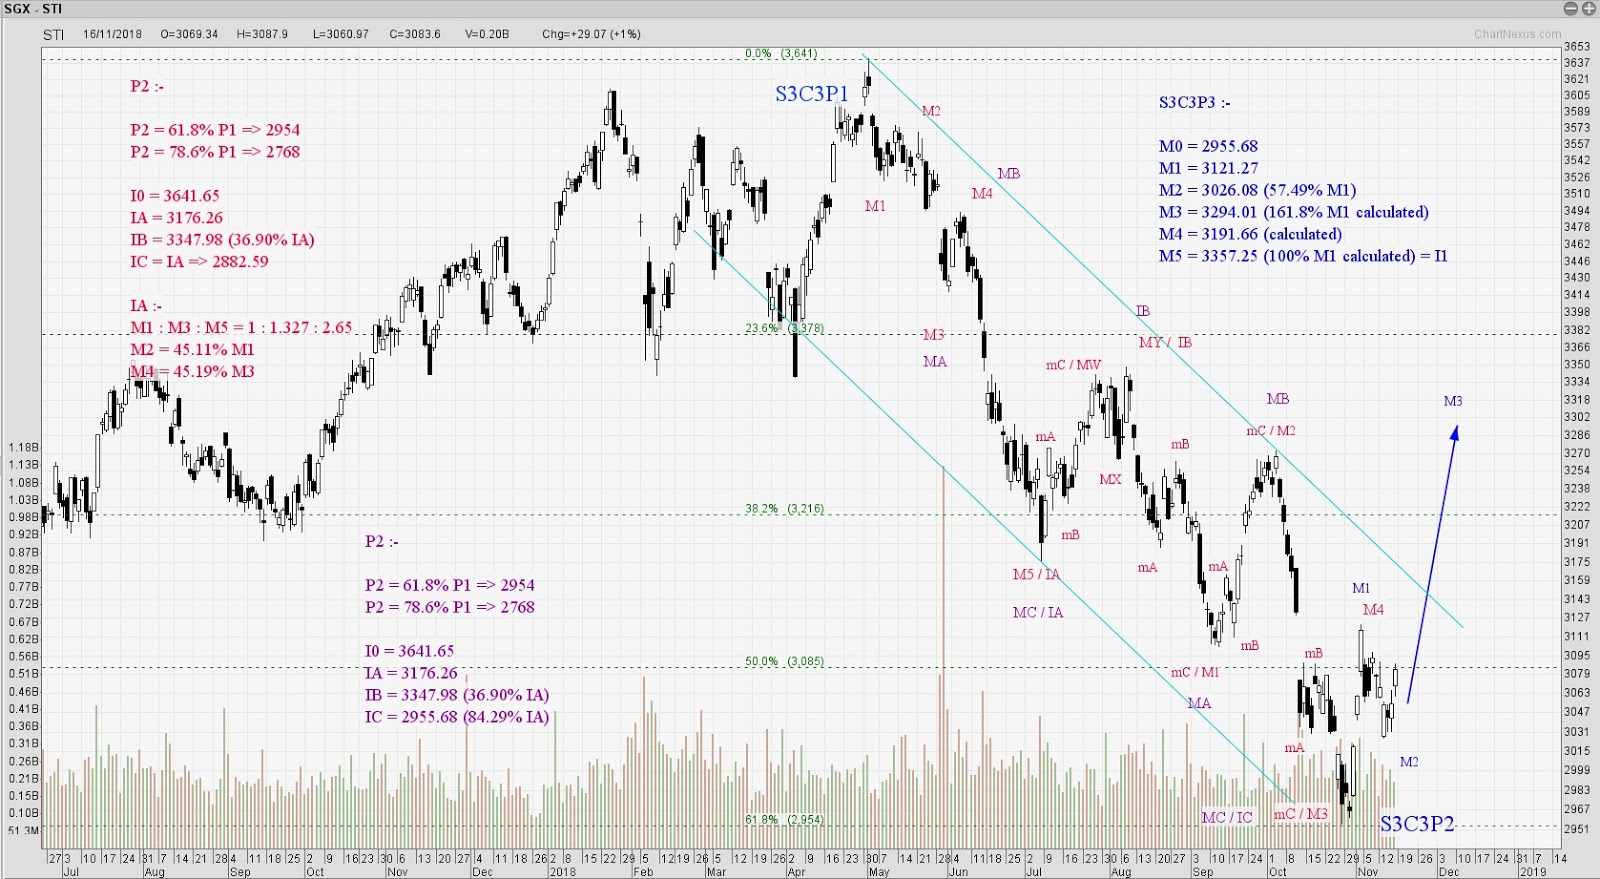
There isn't any convincing confirmation that STI has ended the correction at 2955.68 or still have a final downside.  With that, STI now still taking both possibilities -- correction ended or still in correction.


A very messy chart as trying to squeeze all views in it but will go through in detail.

1. STI still trap within the downtrend channel (light blue colored).  It is only a breakout from it will give strong confirmation of correction is over (probably not in the sense of Elliott Wave analysis).  The downside is STI could be go down to touch the lower boundary of the channel for the last time.  That is why STI still having both possibilities.

2. The Red label is for the case of Elliott Wave count STI still have 1 more downside as ...
Read the full article
By ccloh Strategic Investor Zone
Am a typical retail investor who started investing in stock market in 1993, the same length of period as SingTel was listed in SGX and ironically SingTel was my first vested stock. Back then was a passive investor and started to turn more active in stock market in 2006. A year later when I switched my engineering job to a finance related one, I became what commonly known as trader ( trade for living ) and at the same time also strongly believe in fundamental/value investing that is the way to growth wealth. In a way I classify myself as a "Strategic Investor". As a trader, I track market movement daily and as an value investor, I am always on the lookout for cheap bargain to hold for long term.
LEAVE A COMMENT
LEAVE A COMMENT

Your email address will not be published.

*

Your Email Address will not be published
*

Read More Articles
More from thefinance