STI Analysis — the next peak and trough ? (34)
By ccloh Strategic Investor Zone  •  December 1, 2018
Continued from STI Analysis -- the next peak and trough ? (33)

Previously, mentioned STI still stuck in both scenario of still in correction and doing post-correction uptrend by Elliott Wave count.  However, new development surfaced for the past 1 week.


Still In Correction
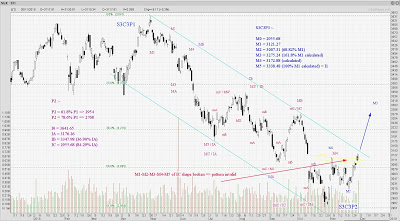
This is the Elliott Wave count marked in Red in the above chart.  However, due to the development of STI in the past 1 week rising above 3121.27, this has broken the pattern of the correction.  That is the M1-M4 wave in IC wave is no longer valid.  As such, the Elliott Wave count associated to it is considered invalid.  So does that mean STI correction since May 2018 has ended at 2955.68 on 26th Oct 2018 ?  In Elliott Wave count it is a YES since the correction pattern, the wave count is no longer valid.  However, to ...
...
Read the full article
By ccloh Strategic Investor Zone
Am a typical retail investor who started investing in stock market in 1993, the same length of period as SingTel was listed in SGX and ironically SingTel was my first vested stock. Back then was a passive investor and started to turn more active in stock market in 2006. A year later when I switched my engineering job to a finance related one, I became what commonly known as trader ( trade for living ) and at the same time also strongly believe in fundamental/value investing that is the way to growth wealth. In a way I classify myself as a "Strategic Investor". As a trader, I track market movement daily and as an value investor, I am always on the lookout for cheap bargain to hold for long term.
LEAVE A COMMENT
LEAVE A COMMENT

Your email address will not be published.

*

Your Email Address will not be published
*

Read More Articles
More from thefinance