STI Analysis — the next peak and trough ? (35)
By ccloh Strategic Investor Zone  •  December 8, 2018
Continued from STI Analysis -- the next peak and trough ? (34)

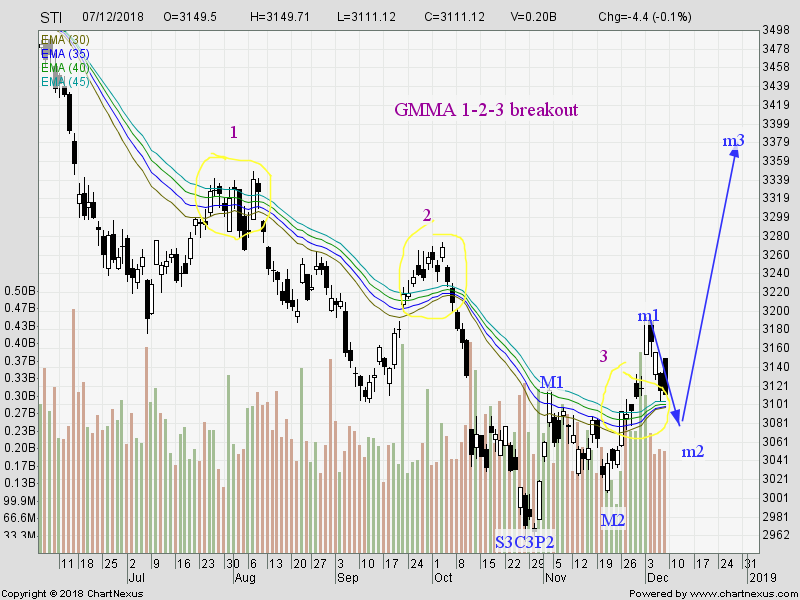
The pull back for STI after hitting 3192.88 on 3rd Dec 2018 wasn't something unexpected.  The pull back should have some more downside to go to around the 3078 level and it does look very possible next week given STI closed 3111.12 on 7th Dec 2018.  This is because considering STI is developing into a 3rd wave extension of 3rd wave pattern as shown in the chart below.


The 3rd wave is the M3 wave and its extension is the 5-wave pattern of its lower degree, the Minute degree (m1 - m5).  The pull back STI is doing now is the m2 corrective wave.  For this pattern to be valid, the current pull back should not fall below 3007.31 while a drop below 3047 (the 78.6% Fibonacci level) could be an ...
...
Read the full article
By ccloh Strategic Investor Zone
Am a typical retail investor who started investing in stock market in 1993, the same length of period as SingTel was listed in SGX and ironically SingTel was my first vested stock. Back then was a passive investor and started to turn more active in stock market in 2006. A year later when I switched my engineering job to a finance related one, I became what commonly known as trader ( trade for living ) and at the same time also strongly believe in fundamental/value investing that is the way to growth wealth. In a way I classify myself as a "Strategic Investor". As a trader, I track market movement daily and as an value investor, I am always on the lookout for cheap bargain to hold for long term.
LEAVE A COMMENT
LEAVE A COMMENT

Your email address will not be published.

*

Your Email Address will not be published
*

Read More Articles
More from thefinance