


Current Market is good for Reits/Trust again with low growth and low rates. Interestingly is good for banks too because of increase rates from past year. DBS bank did well and this helps STI largely with UOB and OCBC close behinds. Even Singtel managed to bounce off from lows.
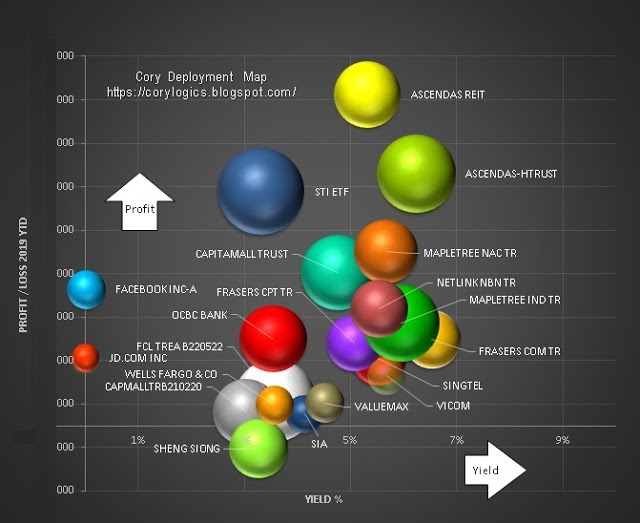
In a continuation of how individual investment return looks like for dividend investors, I think Bubble Chart is best to depicts the absolute P/L against the yield of the stock at current price. For people who is new to the chart, the size of the bubble is the investment value at current price.
Do note the vertical axis P/L is Released/Unreleased combine. Most of it is unrealised profit as I hold them for long term dividends.
As you can see Ascendas "Sun" continues to be high up there (higher since last blogged) amid slightly smaller investment size for Kiasi me....


