


I think for newbie investors, these 2 weeks have been a bit surreal. For as long as I could remember, we seldom have days of 2-3% daily up moves and 2-3% daily down moves since the financial crisis.
On usual markets, we should have the odd 2-3% moves but they should be over pretty fast.
A possible sign of a bear market is when you have many of these 2 to 4% daily moves clustering together.
Today’s post consists of some of the data that I see out there. It might be useful or might not be useful.
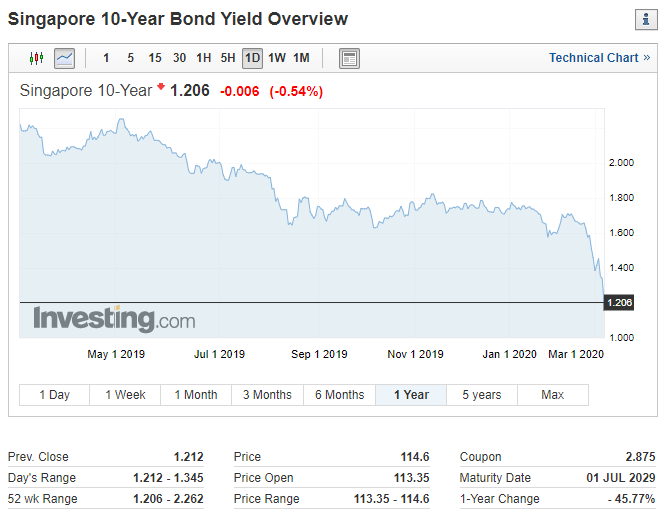
The chart above shows the 1-month yield change for Singapore’s 10-year government bond yield.
The 10-year government bond yield indicates a few things for me:
It is the rate where corporate bonds take reference from when pricing their debtsIt generally indicates the GDP growth of a countryInflation expectationsIt shows...


