This post was originally posted here. The writer, Kenny Loh is a veteran community member and blogger on InvestingNote, with username known as marubozu and 700+ followers.
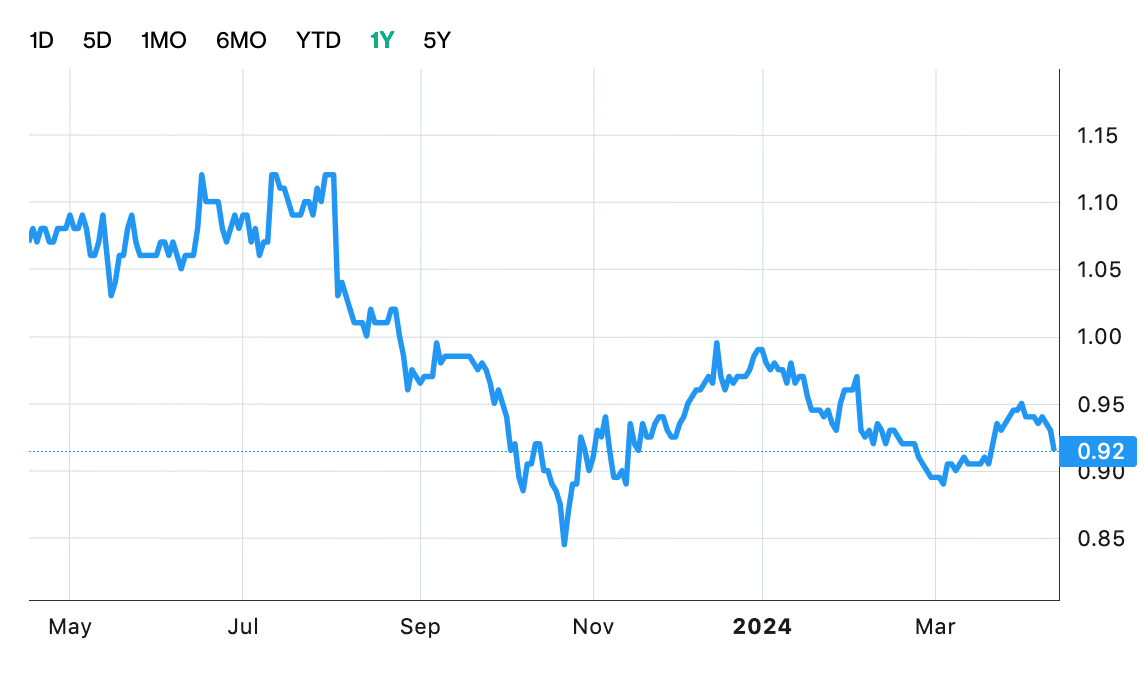
FTSE ST Real Estate Investment Trusts (FTSE ST REITIndex)broke outfrom the 10 years resistance at 875 with significant increase in trading volume. The REIT index is currently retracing from the high 941.77 to 895.14 (-4.95%). Next immediate support zone is between 870 to 875 for a healthy correction. Previous chart on FTSE ST REIT index can be found in the last postSingapore REIT Fundamental Comparison Tableon July 1, 2019.
Based on the current chart pattern and and momentum, the sentiment isBULLISHand the trend for Singapore REIT direction is stillUP.The recent selling can be a healthy correction before the REIT index can move higher.
Fundamental Analysis of 42 Singapore REITs
The following
...