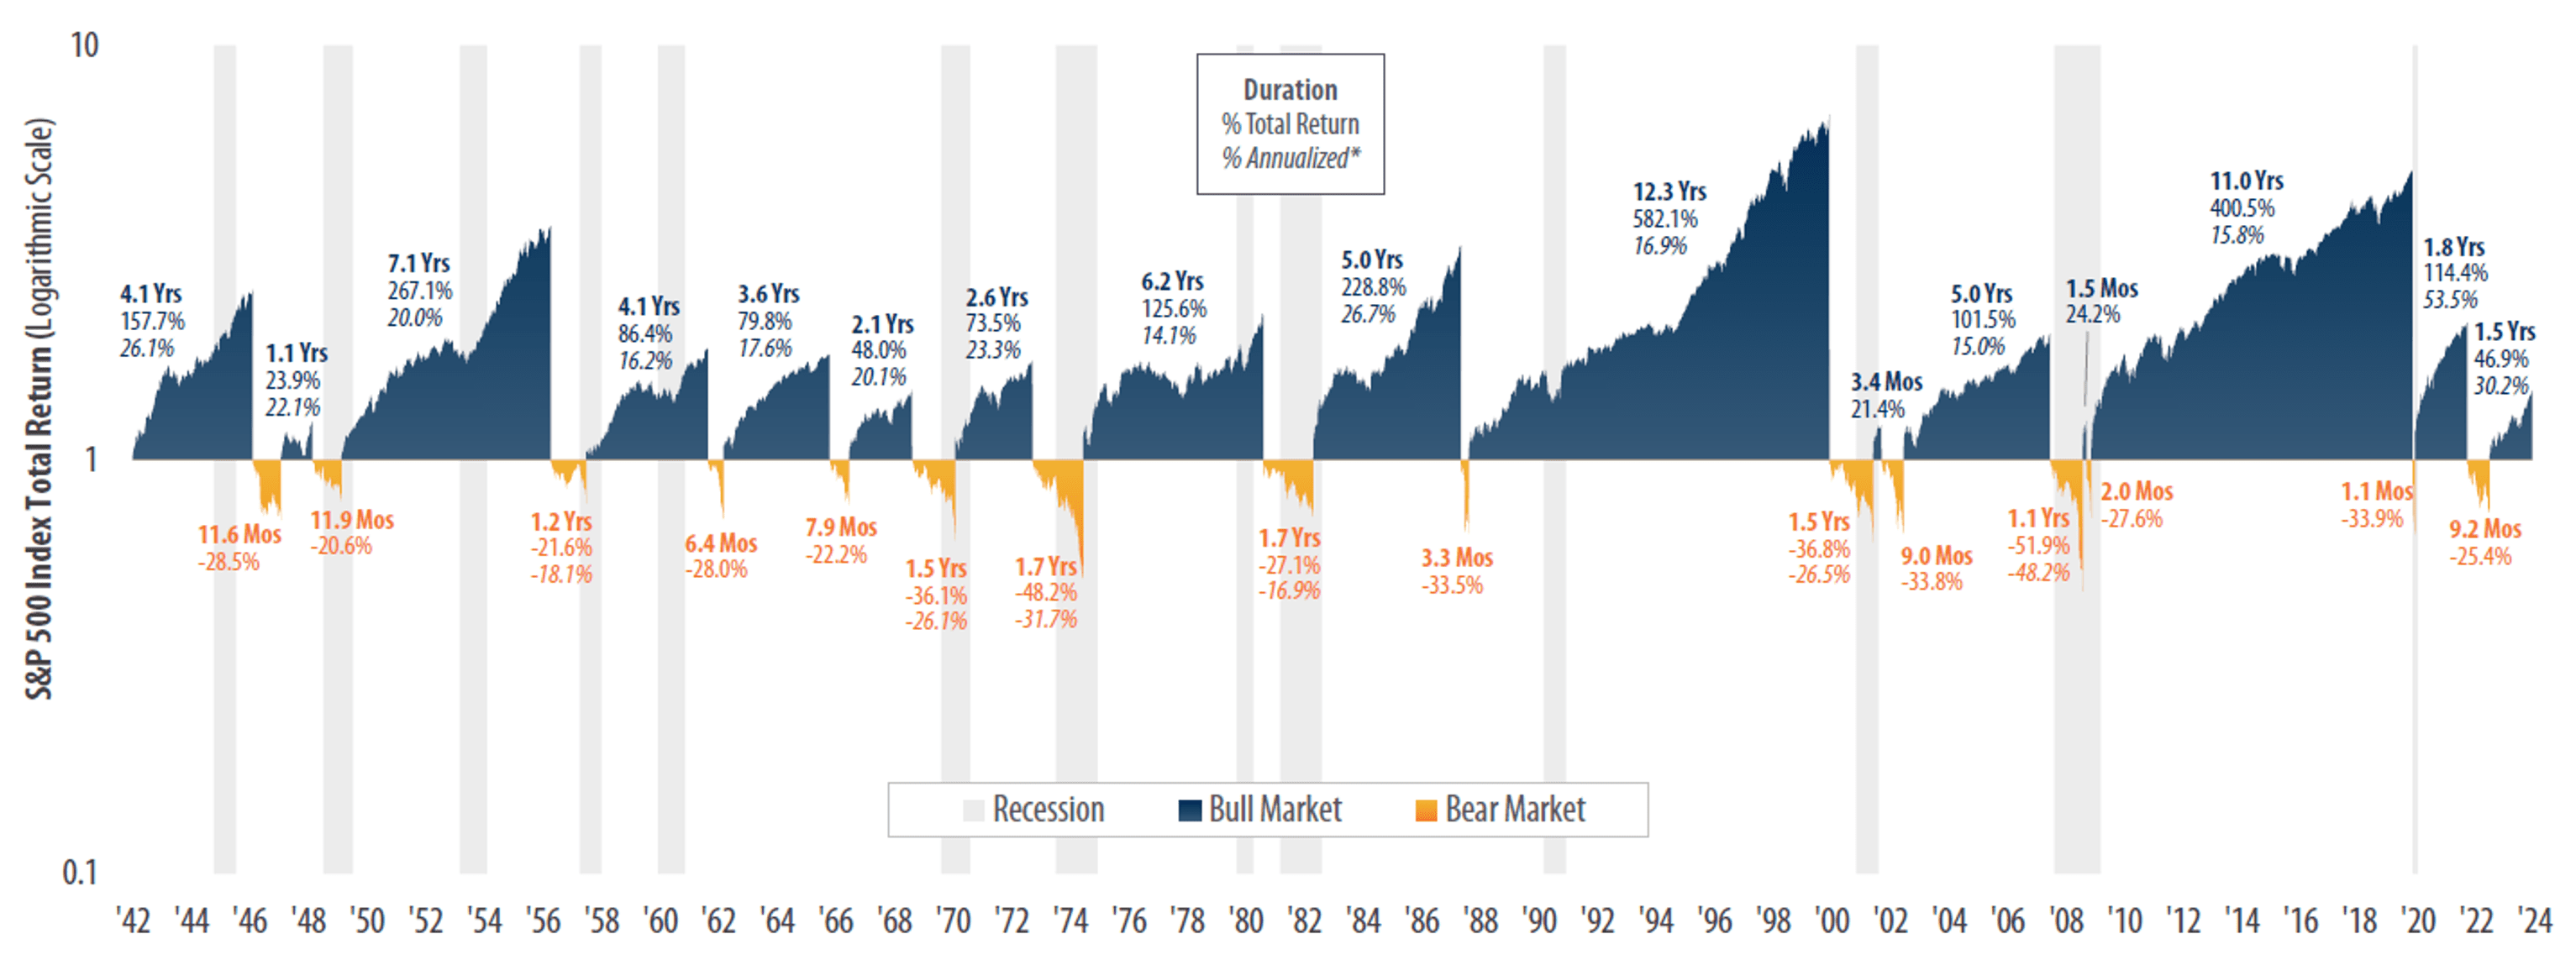
With reference to my earlier write-up (click HERE) titled “S&P500 at 2,979 – limited potential upside (8 Sep 19)”, S&P500 touched intraday highs of 3,021 – 3,022 on 12 Sep 2019 and 19 Sep 2019 but it was still lower than the record intraday high of 3,028 on 26 July 2019. S&P500 closed at 2,962 on 27 Sep 2019.
Hang Seng and STI touch one-month intraday highs on 13 Sep 2019 before profit taking sets in. October is likely a volatile month ahead given (just to cite a few examples) more news on trade talks (e.g. U.S vs China; U.S. vs EU etc); economic data; Brexit; U.S. 3Q corporate results; geopolitical risks etc.
To add to the wall of worry, Nasdaq seems to be forming a potential bearish head and shoulders formation. Let’s take a closer look at the charts and other developments.
Nasdaq chart analysis
Based on Chart
...