


Continued from STI Analysis -- the next peak and trough ? (57)
It's strange and unusual that this is the 3rd STI analysis within 10 days. Perhaps it is during these crisis periods (Wuhan Coronavirus) that made stock market going "haywire" that seeing this is a good opportunity to archive down for learning.
As usual, only focus on the STI-N scenario and as for the STI-2 scenario is in the stage of awaiting it for rule violation to be invalidated.
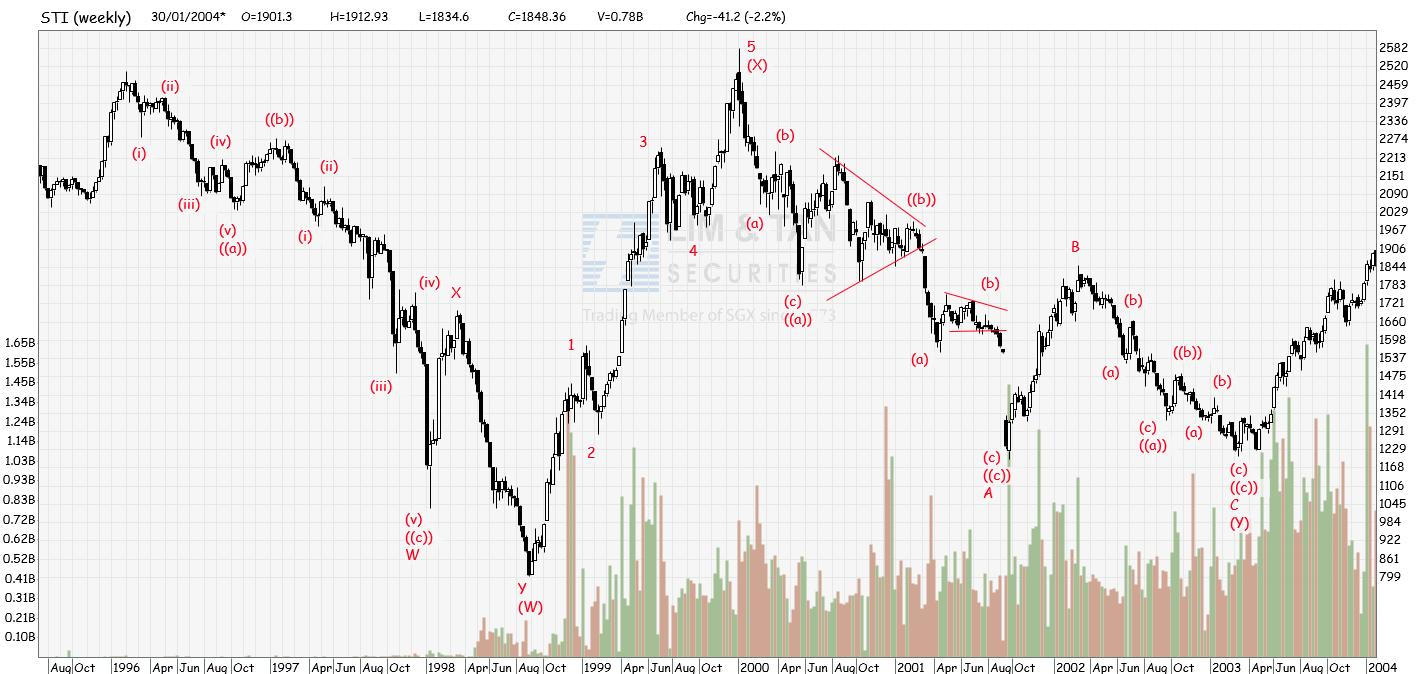
Flash back to the period of 1996 to 2003 for STI performance.
STI peaked in 1996 and then went through a corrective phase till 2003. That was like a 7 years period of correction and it rightly fit the bill of a SuperCycle degree wave (whether it is wave 2 or wave 4 unfortunately is uncertain as there isn't much STI data prior to 1996 to determine the wave count). During these periods, couple...


