


Continued from STI Analysis -- the next peak and trough ? (61)
Finally, the low of 2528.44 in 2016 has broken when STI registered an intra-day low of 2510.88 on 13th Mar 2020. This has a lot of implication towards the analysis work done so far which will be elaborate further.
STI-N
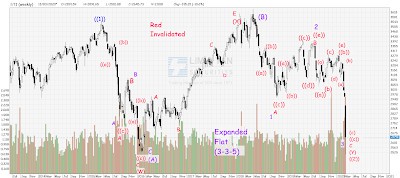
The above is the wave count with STI in the Cycle wave (C) stage of the SuperCycle wave ((2)). The 2 possible wave counts for Cycle wave (C) are denoted as Red and Purple.
Red Wave Count (INVALIDATED)
As STI fell below 2723.269 meaning wave C has retracted more than 161.8% of wave A making it invalid in this wave count. Reason was mentioned in previous post.
Purple Wave CountThis now become the only wave count for STI to play out and so far the movement of STI has shown it is following this wave count.
Above is the 5-wave generated value from the Fibonacci...


