


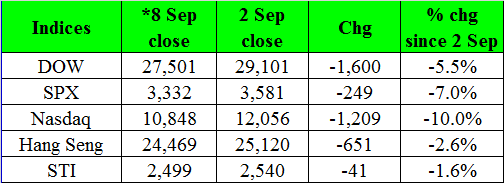
Dear all Based on Table 1 below, U.S. indices have fallen between 5.5% – 10% from the close of 2 Sep to 8 Sep. Nasdaq led the decline with a 10% drop. These are interesting times indeed! Why do I say so? Read on below. Table 1: Performance of various indices from 2 Sep to 8 Sep 20 Source: Ernest’s compilations (STI and Hang Seng are based on 9 Sep closing prices) In my personal opinion, this recent U.S. market weakness provides accumulation opportunities for the well prepared and for those who have been waiting on the side-lines to accumulate blue chip stocks. Below are some of my chart observations on the U.S. and Asian indices. Nasdaq chart Based on Chart 1 below, there is a good chance that Nasdaq may see a reduction in selling pressure in the near-term as a) It forms a bullish inverted hammer...


