


On 3 Sep 2020, I posted it on Facebook that Nasdaq is at risk of a correction.
Fortunately or unfortunately, my trade plan was right as Nasdaq dropped almost 5% after it closed on 3 Sep 2020.
Nasdaq went on to lose 1% and 4% in the subsequent trading days, and it officially went in the correction territory (-10%).
Let me explain the warning signs that I foresaw.
I use a trading technique known as price action and volume analysis. The trendlines which you see in the charts are drawn over the years and they become more valuable overtime, as they form critical support and resistance lines that help me interpret the price actions.
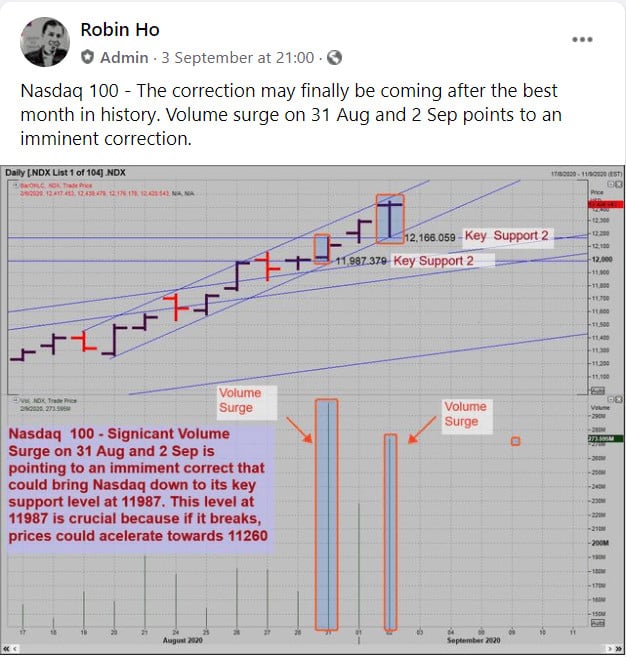
On 31 Aug 2020, the price crossed the Key Support 1 of my trendlines with heavy volume. On 2 Sep 2020, Nasdaq went up higher and cleared the Key Support 2 on high volume too.
These ain’t normal – you don’t want to see prices making new highs and breaking trendlines on high volumes because they are signs of distribution....


