


When we invest in a company’s shares, we are making a long-term bet that the share price will rise over time. But in investing, we never deal in absolutes but rather a range of probable outcomes.
This is where understanding the concept of a distribution of possible outcomes becomes useful. Using what we know now, we can build a simple distribution model of long-term returns. This will, in turn, guide us on whether a stock makes a good investment and if so, how much capital should we allocate to it. Here are some common distribution model graphs and how they impact our investing decisions.
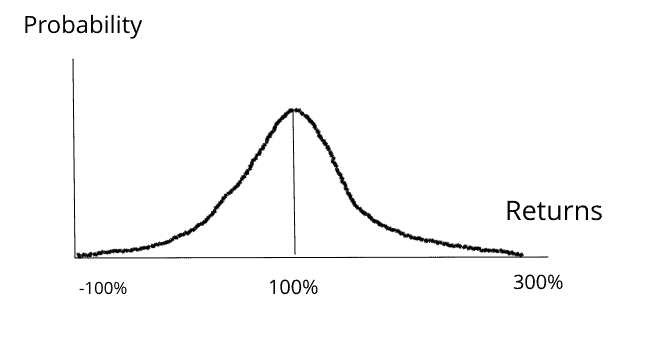
Normal distribution
This is the most common probability distribution curve. Let’s assume that a stock is expected to double after 10 years. The distribution curve for a stock with a normal distribution of returns will look something like this:
Source: My illustration using Sketch.io...


