


STI first week of rally stopped at resistance level 2533
With minimal ups and downs happening in STI, it is hard to chart reliable support and resistance levels. At the moment STI is still on the rise although experiencing some resistance at 2533 as shown on the weekly chart last week. Companies are set to release their next financial reports in the coming week therefore expect volatility and volume to increase. Cyclical stocks like banks, tourism, and the aviation sector still hammered by the impacts of low-interest rates, and travel restrictions will expect a slow recovery for the rest of 2020. Although, the QoQ performance will likely be positive for investors who are vested since Q2.
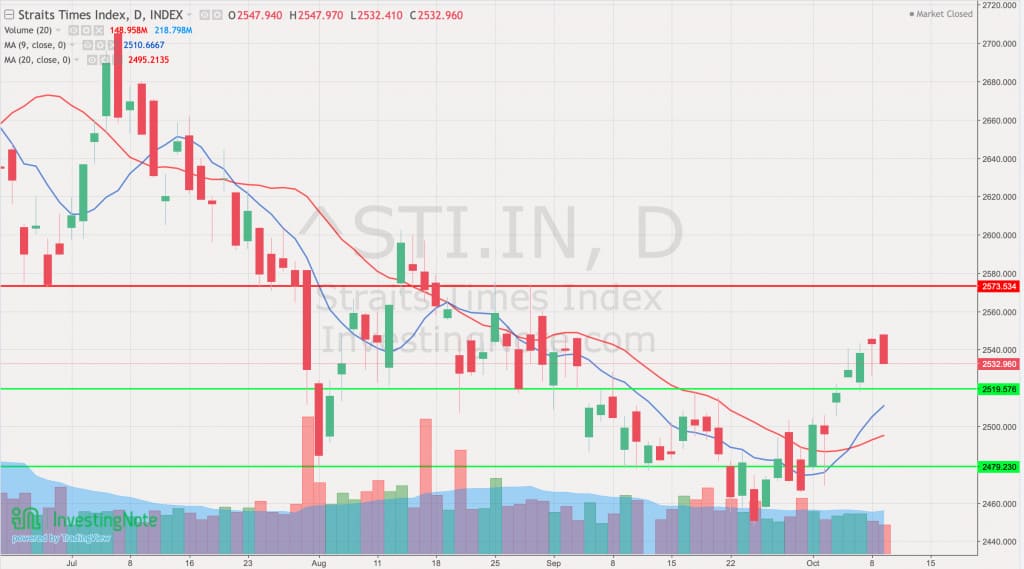
STI – Updated Daily Chart
STI daily chart shows a slightly convincing breakout from 2500 psychological level. The sharp drop on Friday reflects trades made by short term trades in the market. Comparing 9 and 20 days MA, STI is still on an uptrend with the next support level at 2519....


