


I'm starting a new weekly series, where I will give an overview/snapshot of how certain sectors have shifted week to week. For a start, I will be looking at STI components, and S-REITs. If you have other companies to suggest, drop me an email.
S-REITs
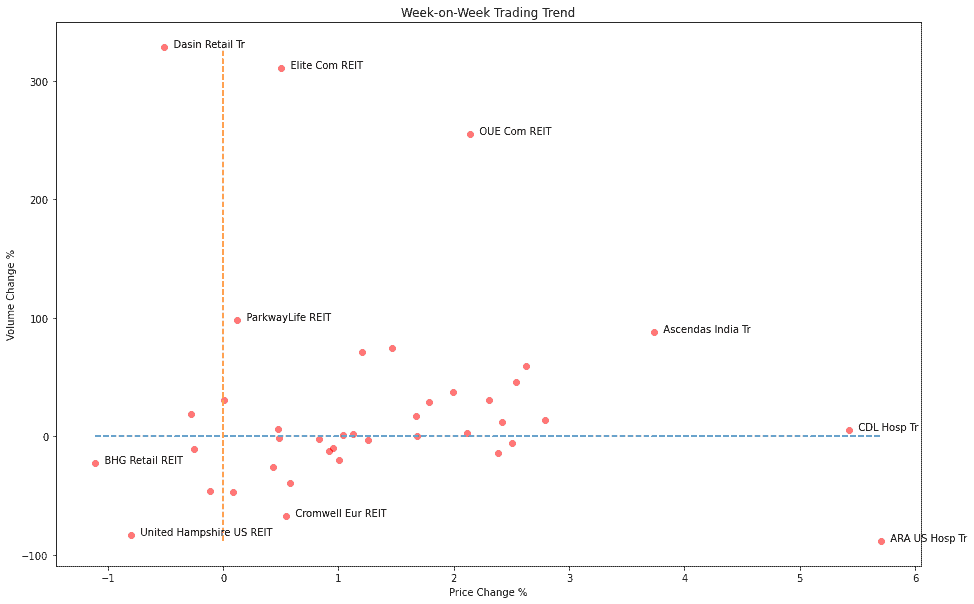
The y-axis and x-axis shows how much the volume and price changed from last week to this week. The weekly price is determined by averaging open, close, low and high prices, then weighting it by volume across the days in the week. Using VWAP would be ideal, but I can't find a free source for that. The current method would be pretty indicative of general sentiment too, for most cases. In general, REITs saw a week-on-week price appreciation, while volume changes were mixed between different REITs.
Sector Level: Dasin Retail Trust was the outlier amongst Retail REITs, seeing a 300+% increase in volume...


