


Here are some updates for this round:
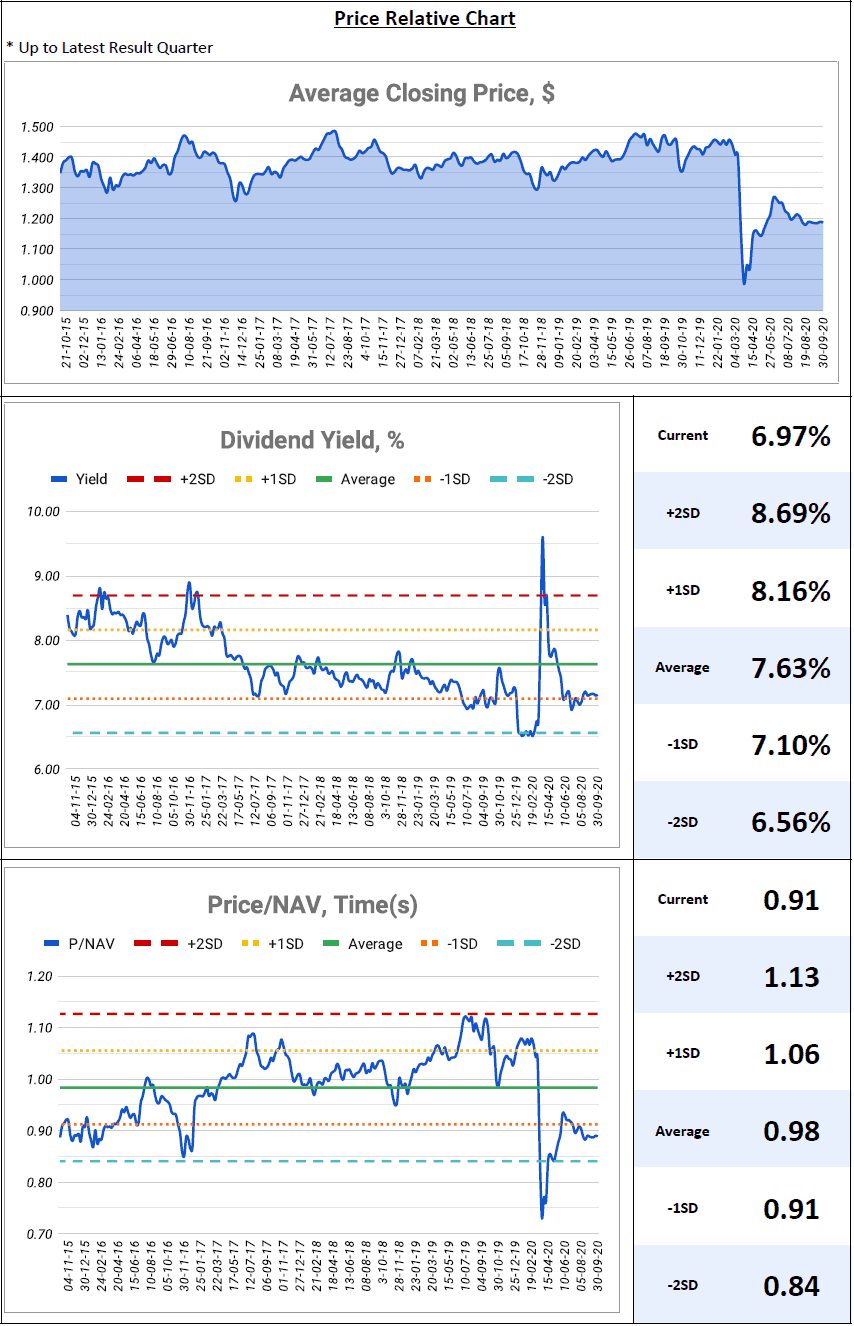
1) Price Relative Chart- Replaced quarter average closing price to weekly average closing price for a better presentation and optimal loading speed. The weekly average price chart trend very closely resembles the daily closing price chart trend. Moreover, the weekly average closing price would save loading time tremendously.- Dividend yield is based on TTM DPU or annualized DPU instead of a quarter or semi-annual DPU.- Added standard deviation (SD) figures for +2SD, +1SD, -1SD and -2SD.- Removed high and low figures.- Customized chart min. value for each REIT for a better view.
2) Lease Profile - Added assets under management, this figure includes interests in associates and joint ventures.
3) Trends- Added outstanding shares trend, a higher-than-normal increase indicates equity fundraising or merger in the particular quarter. - Added management fees over the distribution trend, a higher-than-normal value indicates...


